
Delphi Technique: Predicting Emerging Opportunities and Challenges in Renewable Energy
1 | Background and Context
Renewable energy (RE) is central to achieving the Sustainable Development Goals (SDGs) and responding to the urgency of climate change. According to the United Nations, the availability of affordable and clean energy (SDG 7) is an explicit and interdependent goal “crucial for achieving almost all [16 other] SDGs,” such as eradicating poverty, improving health and education, supplying clean water, industrialization, and combating climate change. These are further emphasized through SDG 13 on climate action (UN 2018). The Paris Agreement on climate change, which became effective in 2016, places even greater prominence on scaling up RE as a key solution to limiting global temperature rise to no more than 2°C by 2100 and to “make best efforts to limit warming to 1.5°C” (World Bank, IFC, and MIGA 2016).
RE has experienced a dynamic expansion over the years through the development of multiple technologies and has the potential to scale up further in the future. The major RE technologies—hydropower, solar power, wind power, geothermal power, and biopower—produce over a quarter of the world’s electricity (figure 1.1). Hydropower, which has been the dominant technology by scale, makes up the highest proportion in the global RE mix, with a 62 percent share in 2017 (or 16.4 percent of total global electricity production). Around 2000, wind power began to expand at a globally significant scale, followed by a major scale-up of solar photovoltaics (PV) starting around 2008. Together, wind and solar PV made up 7.5 percent of global electricity produced in 2017. For the same year, biopower and geothermal—two long-standing technologies—produced less than 3 percent of global electricity. RE markets experienced a major transformation during the period assessed, with multiple technologies now showing a significant global impact (box 1.1). Future expansions of RE will need to navigate this anticipated continued market volatility.
Figure 1.1. Renewable Energy Share of Global Power Generation, 2017

Figure 1.1. Renewable Energy Share of Global Power Generation, 2017
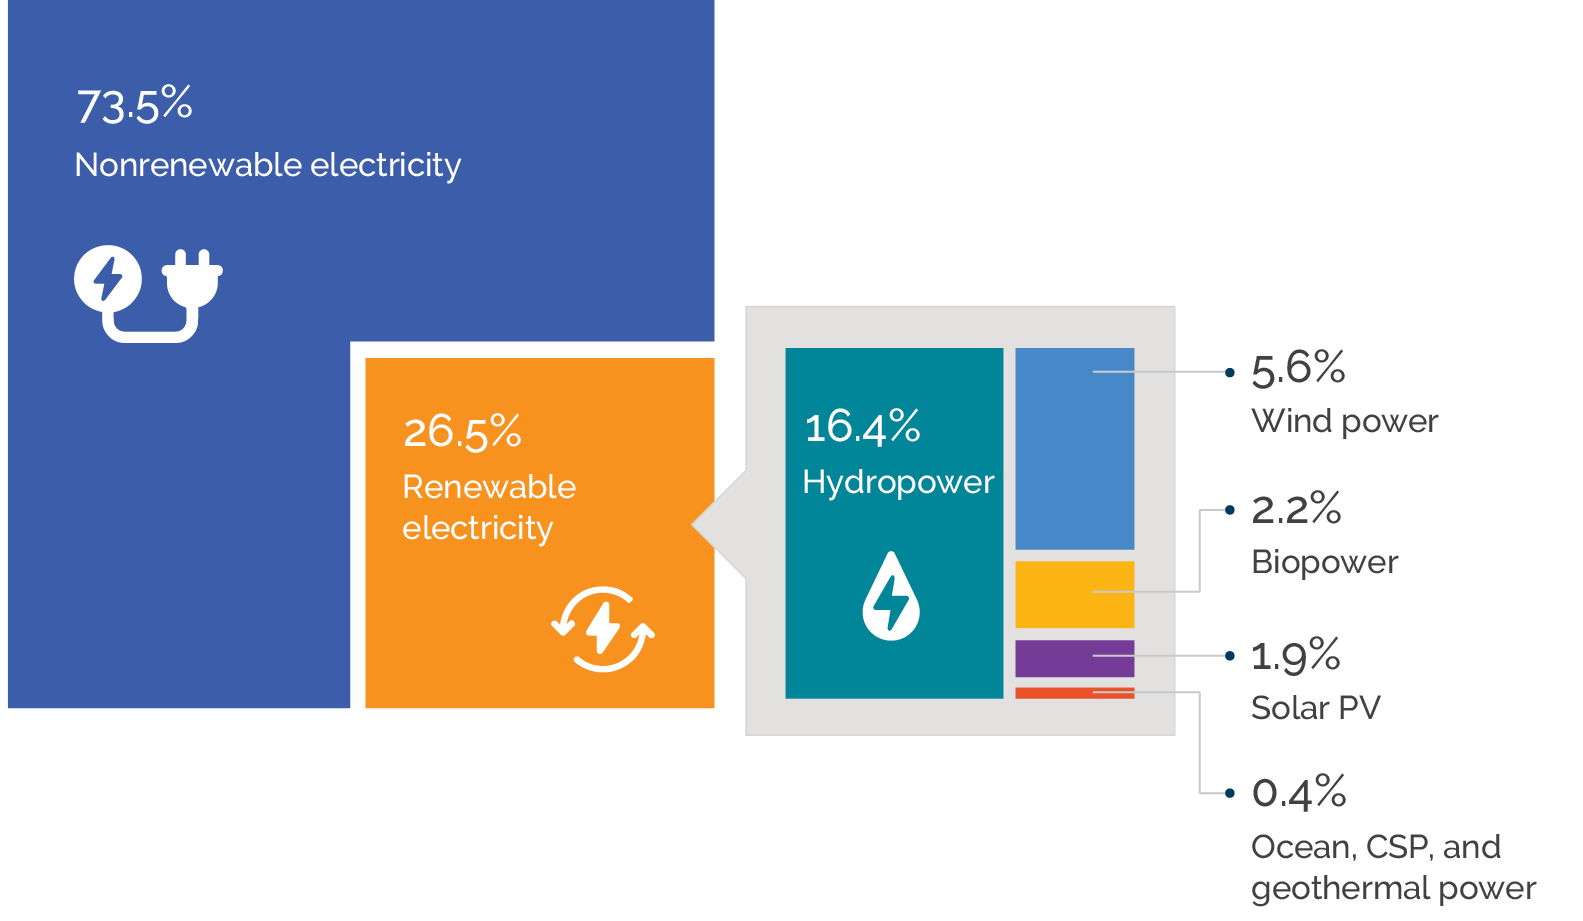
Source: REN21 2018.
Note: CSP = concentrated solar power; PV = photovoltaic.
A very large scale-up in RE is required to achieve global energy and environment goals, which needs to be set in motion immediately and sustained for several decades. Despite the expansion of RE, electricity produced from fossil fuels makes up nearly three-quarters of the global generation mix, since these technologies have also continued to grow. Therefore, the expansion of RE will need to accelerate and be sustained so that the growth of fossil-based technologies can be reduced without locking in a less sustainable pathway to meeting energy demand. Several studies propose different pathways to achieving such goals, but all options involve an unprecedented scale-up in RE.1 One such analysis by the International Energy Agency used in a 2019 report by the Intergovernmental Panel on Climate Change estimates that the RE share in the global energy mix will need to more than double by 2030 (consistent with the SDGs) and further accelerate to almost quadruple by 2040—a program of action commonly referred to as the clean energy transition (table 1.1). The 2019 Intergovernmental Panel on Climate Change report calls for “rapid and far-reaching” transitions in the energy sector (among others) to limit global warming to 1.5°C. It is estimated that such an expansion will double the present global level of investments in RE, from $300 billion to $600 billion (IEA 2017, 2019; IRENA 2017).
Table 1.1. A Pathway to Achieving the Clean Energy Transition
|
Renewable Energy Technology |
Installed Capacity (GW) |
Average Annual Increase (percent) |
Average Capacity Addition (GW/year) |
Electricity Produced (TWh) |
||||
|
2016 |
2030 |
2040 |
2016 |
2030 |
2040 |
|||
|
Hydropower |
1,241 |
1,723 |
2,060 |
2.1 |
34.0 |
4,070 |
5,688 |
6,928 |
|
Wind |
466 |
1,706 |
2,629 |
7.5 |
90.0 |
981 |
4,193 |
6,950 |
|
Solar PV |
299 |
1,846 |
3,246 |
10.4 |
123.0 |
303 |
2,732 |
5,265 |
|
Biopower |
127 |
243 |
347 |
4.3 |
9.2 |
570 |
1,209 |
1,807 |
|
Geothermal |
13 |
44 |
82 |
8.0 |
2.9 |
86 |
292 |
563 |
|
CSP |
5 |
92 |
328 |
19.0 |
13.5 |
11 |
287 |
1,066 |
Source: Based on International Energy Agency forecasts for its Sustainable Development Scenario.
Note: 2030 represents a target consistent with meeting the Sustainable Development Goals. CSP = concentrated solar power; GW = gigawatt; PV = photovoltaic; TWh = terawatt-hour.
The World Bank Group has mainstreamed its support to RE and is committed to the SDGs and the climate goals in the Paris Agreement. The institution has a long history of financing hydropower, but its support for other RE technologies was initially modest and mostly for increasing electricity access, particularly in rural areas not served by the power grid. However, in 2004, the president of the Bank Group made a commitment at the Renewable Energy Conference in Bonn, Germany (the Bonn Commitment) to increase its lending for RE by 20 percent over five years (figure 1.2). This commitment coincided with the global expansion in wind and predated the boom in solar power that followed. After the Bonn Commitment, there was a notable uptick in the Bank Group’s financial support to RE covering all major technologies, averaging about $2 billion per year. The scale-up in funding extended to the greater involvement of the private sector, including through the International Finance Corporation and the Multilateral Investment Guarantee Agency—two institutions within the Bank Group. Although the Bank Group’s financing for RE is dwarfed by the $300 billion in annual global flows into the sector, the institution’s significant international role in supporting reforms, convening partners and mobilizing financing, and disseminating global experiences is a unique position of influence. It also explains the Bank Group’s interest in evaluating its performance in support of RE so that it is optimally geared to help client countries successfully navigate the clean energy transition.
Figure 1.2. World Bank Group Commitment to Renewable Energy, 2000–17

Figure 1.2. World Bank Group Commitment to Renewable Energy, 2000–17

Source: World Bank Group 2018.
Note: The renewable energy portfolio evaluated includes 18 additional projects that had been approved previously and were evaluated in 2000 or later. IFC = International Finance Corporation; MIGA = Multilateral Investment Guarantee Agency.a. Total commitment amounts do not include issuances of MIGA guarantees.
Box 1.1. The Evolution of Renewable Energy and Other Generation Technologies
The global power supply has evolved over time, with renewable energy (RE) playing an increasing role. Global electricity production grew more than fourfold over the 45 years between 1970 and 2015, with shifts in the mix of generation technologies (IEA; figure B1.1.1). Thanks to its reliability and low production cost, coal grew steadily to the main nonrenewable source of global power generation, representing nearly 40% of total production by 2015. Hydropower is a long-standing RE technology that has also continued to increase, although its share of global electricity declined from 23 to 17 percent over 1970–2015, as fossil fuel use grew more rapidly over the same period.
Figure B1.1.1. Shifting Fuel Sources for Global Production of Electricity, 1971–2015

Figure B1.1.1. Shifting Fuel Sources for Global Production of Electricity, 1971–2015
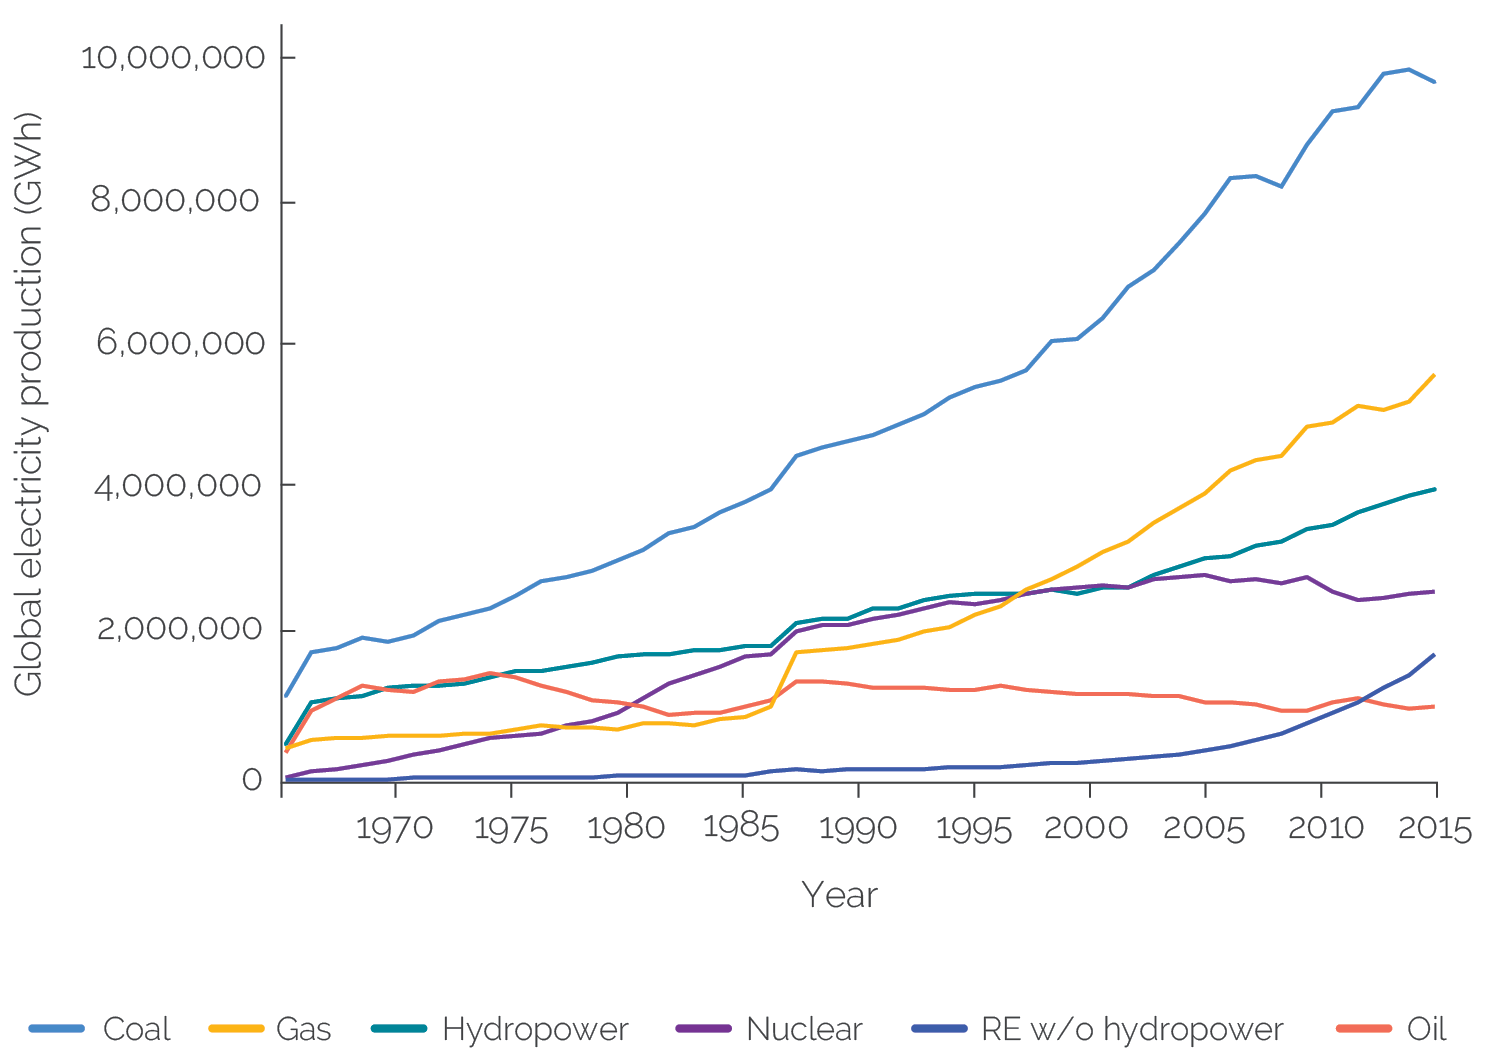
Source: Independent Evaluation Group, based on International Energy Agency data.
Note: GWh = gigawatt-hours; RE = renewable energy.
Decreases in prices led to a rise in the use of oil for power generation in the early 1970s, followed by a decline later in the decade resulting from global oil shocks. Nuclear power, viewed as an alternative to fossil fuels, expanded until the 1990s, but several accidents progressively led to a slow-down in its growth out of safety concerns. Natural gas was used sparingly for power generation, with a global share of only 13 percent in 1971, mostly confined to countries that produced the fuel. However, technological advances in extraction and more efficient means of transportation allowed natural gas to overtake hydropower as the second-largest fuel source for power production by the late 1990s.
RE technologies such as wind power and solar photovoltaics were initiallly developed at small scale or for demonstration purposes before their rapid global expansion began in 2000. Electricity produced from these sources grew from negligible shares in the early 2000s to reach a combined share of 7.5 percent of global electricity produced by 2017. Other more niche RE technologies, such as geothermal power, concentrated solar power, and biopower, are not globally significant by scale, but some make important contributions in specific countries.
- The Intergovernmental Panel on Climate Change 2019 Report considers the following studies: the Energy Technology Perspectives (ETP) (series IEA 2014, 2015, 2016, 2017), the IEA and IRENA reports (OECD/IEA and IRENA 2017), and the Shell Sky Scenario (Shell International Finance B. V. 2018).Shell Corporation, ‘Sky’ scenario (2019): www.shell.com/skyscenario, accessed April 2021.