
The World Bank Group in Mozambique, Fiscal Years 2008–21
Chapter 4 | Support for Access to Basic Services
Highlights
World Bank projects during the evaluation period have progressively targeted provinces that have insufficient access to education, health, transport, and electricity. Widespread disparities in access to these basic services in rural and urban areas were recognized by the World Bank’s analytical work. However, World Bank projects targeted these poorer areas only in the later part of the Country Program Evaluation period. Across services, provinces with insufficient access to education and health have been targeted earlier than those with insufficient access to transport and electricity.
Across virtually all basic services, changes in access for rural areas were positive. Project documents report positive outcomes across provinces in the delivery of health, transport, education, and (in part) electricity services throughout the period. Similarly, Independent Evaluation Group analysis and official statistics from a recent household survey confirm improved access to these services during the evaluation period.
Mozambique is characterized by large inequalities in access to basic services, limiting the degree to which poor people share in economic growth. Income levels and access to health, education, transport, and electricity (henceforth referred to as basic services) are highly unequal across districts, with rural areas in the central and northern parts of the country lagging urban centers. At the beginning of the evaluation period, only 2 percent of rural inhabitants had access to electricity and less than 1 percent had access to water, compared with 40 percent and 13 percent, respectively, of urban inhabitants. Similarly, 61 percent of rural residents were illiterate, compared with 27 percent of urban residents, and almost half of the rural population lived at least one hour away from public transportation, compared with 10 percent of the urban population (National Institute of Statistics 2010). Rural areas are among the poorest in the country; thus, neglect of service provision in rural areas is equivalent to neglecting the poorest regions. This neglect exacerbates grievances, contributes to inequitable outcomes, and reinforces social exclusion (World Bank 2020g). Increasing the availability and quality of health, education, transport, and electricity is key to improving and equalizing opportunities for all citizens and enabling them to share in economic growth (World Bank 2018c).
Throughout the evaluation period, and especially after 2016, World Bank analytical work acknowledged the stark contrast in access to basic services among regions and between urban and rural areas in Mozambique. Using multiple data sources from domestic and development partners,1the evaluation team found several reports across the three strategy periods that recognized the inequitable access to education, health, transportation, and electricity between urban and rural populations. The availability of roads, landlines, internet, and electricity for lighting was a privilege of mainly urban households (Adriano et al. 2012). Mozambique Poverty Assessment: Strong but Not Broadly Shared Growth reaffirmed that location continued to be a strong determinant of access to basic services and acknowledged that despite modest improvements, large disparities remained (World Bank 2018d). Mozambique Economic Update: Shifting to More Inclusive Growth placed an emphasis on public investment in rural areas to strengthen irrigation and access to rural roads and electricity to provide better conditions for increasing agriculture productivity and creating more dynamic rural markets (World Bank 2018c).
However, addressing inequality in access to basic services was not a focus of World Bank interventions until the last strategy period. Inequalities between rural and urban communities were acknowledged in the first strategy, but no specific actions were identified. Only in the health sector was support to rural areas a focus. In the first strategy, the World Bank focused on the decentralization of government functions, which are seen as important to the delivery of basic services. The second World Bank–supported strategy focused mainly on urban areas, leaving rural support to the other development partners. Only in the third strategy did the World Bank put significant emphasis on support to rural areas. It noted that “new planned investments … will focus on geographic zones with weak indicators in the areas of reproductive, maternal, newborn, child, and youth health, areas most often located in the central and northern regions” (World Bank 2017b, 21).
The World Bank supported all four basic services throughout the evaluation period. A total of 61 projects were approved during the FY08–21 period, for a total commitment of almost $5 billion (tables 4.1 and 4.2).
Table 4.1. World Bank Portfolio in Basic Services, Fiscal Years 2008–21
|
Sector |
FY08–11 |
FY12–16 |
FY17–21 |
Total |
|
Projects approved (no.) |
||||
|
Education |
4 |
6 |
7 |
17 |
|
Health |
3 |
3 |
6 |
12 |
|
Transportation |
2 |
9 |
5 |
16 |
|
Energy |
4 |
7 |
5 |
16 |
Source: World Bank Business Intelligence database.
Note: FY = fiscal year.
Table 4.2. World Bank Commitments in Basic Services, Fiscal Years 2008–21
|
Sector |
FY08–11 |
FY12–16 |
FY17–21 |
Total |
|
Commitments (US$, millions) |
||||
|
Education |
205 |
225.7 |
740 |
1,170.7 |
|
Health |
114 |
172.7 |
544.2 |
830.9 |
|
Transportation |
91 |
437.5 |
610 |
1,138.5 |
|
Energy |
200 |
1,250.1 |
367.2 |
1,817.3 |
Source: World Bank Business Intelligence database.
Note: FY = fiscal year.
The World Bank improved its targeting of poorer provinces over the evaluation period. Using provincial income per capita (as a proxy for access to services) and a portfolio of 29 projects (corresponding to about 70 percent of these sectors’ coverage) in 814 locations, the analysis mapped World Bank project sites in each province.2Figure 4.1 presents the distribution across provinces and strategy periods between levels of per capita income and World Bank support. The color of the provinces represents the level of per capita income (with darker colors showing poorer provinces), and the size of the bubbles represents the number of project sites. The map shows that the World Bank’s support to provinces changed over time, with an increase in activities in provinces with lower income per capita.
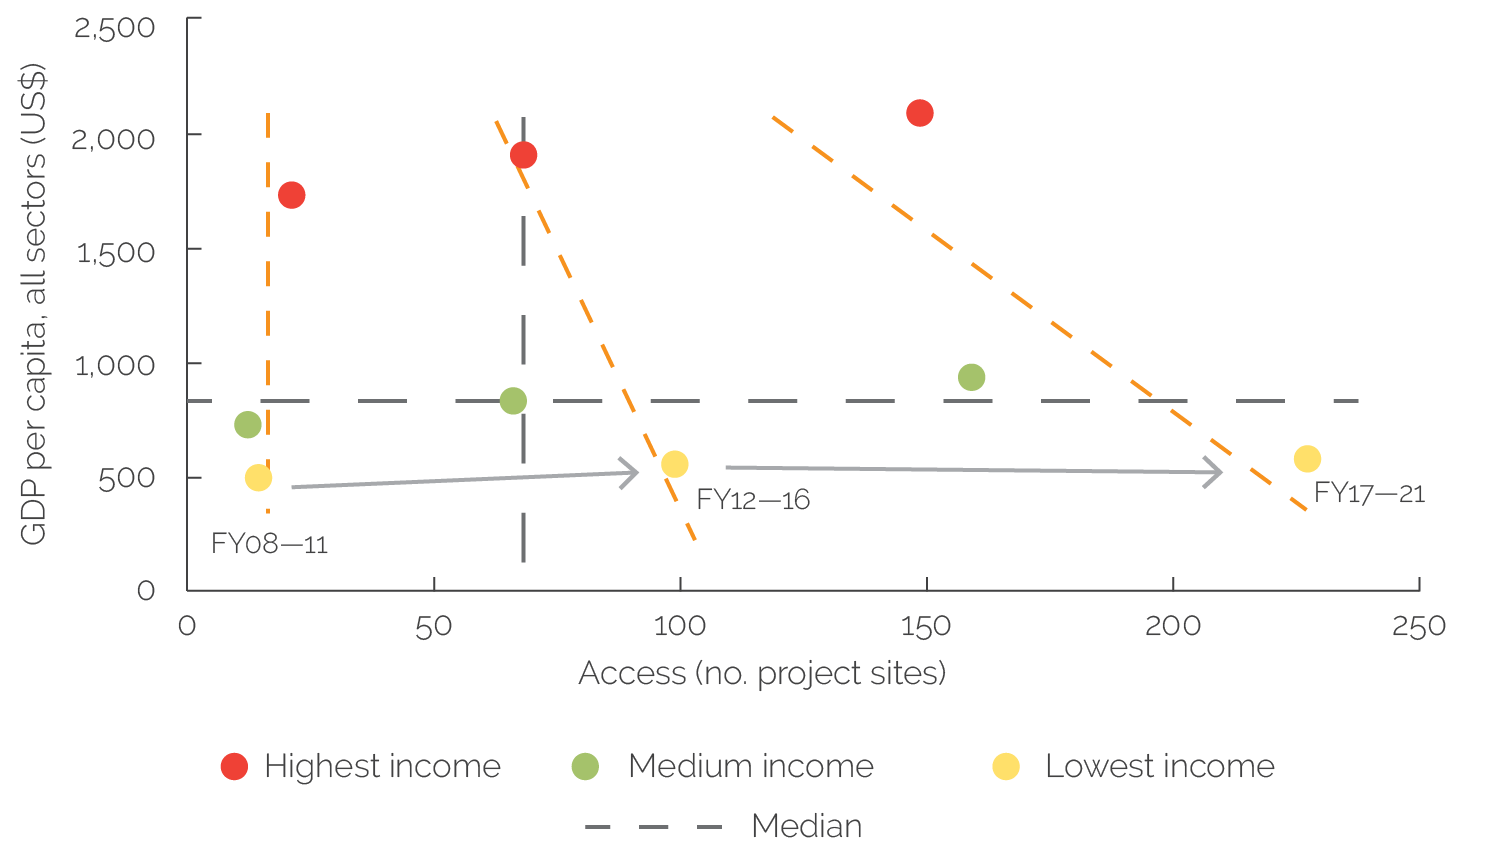
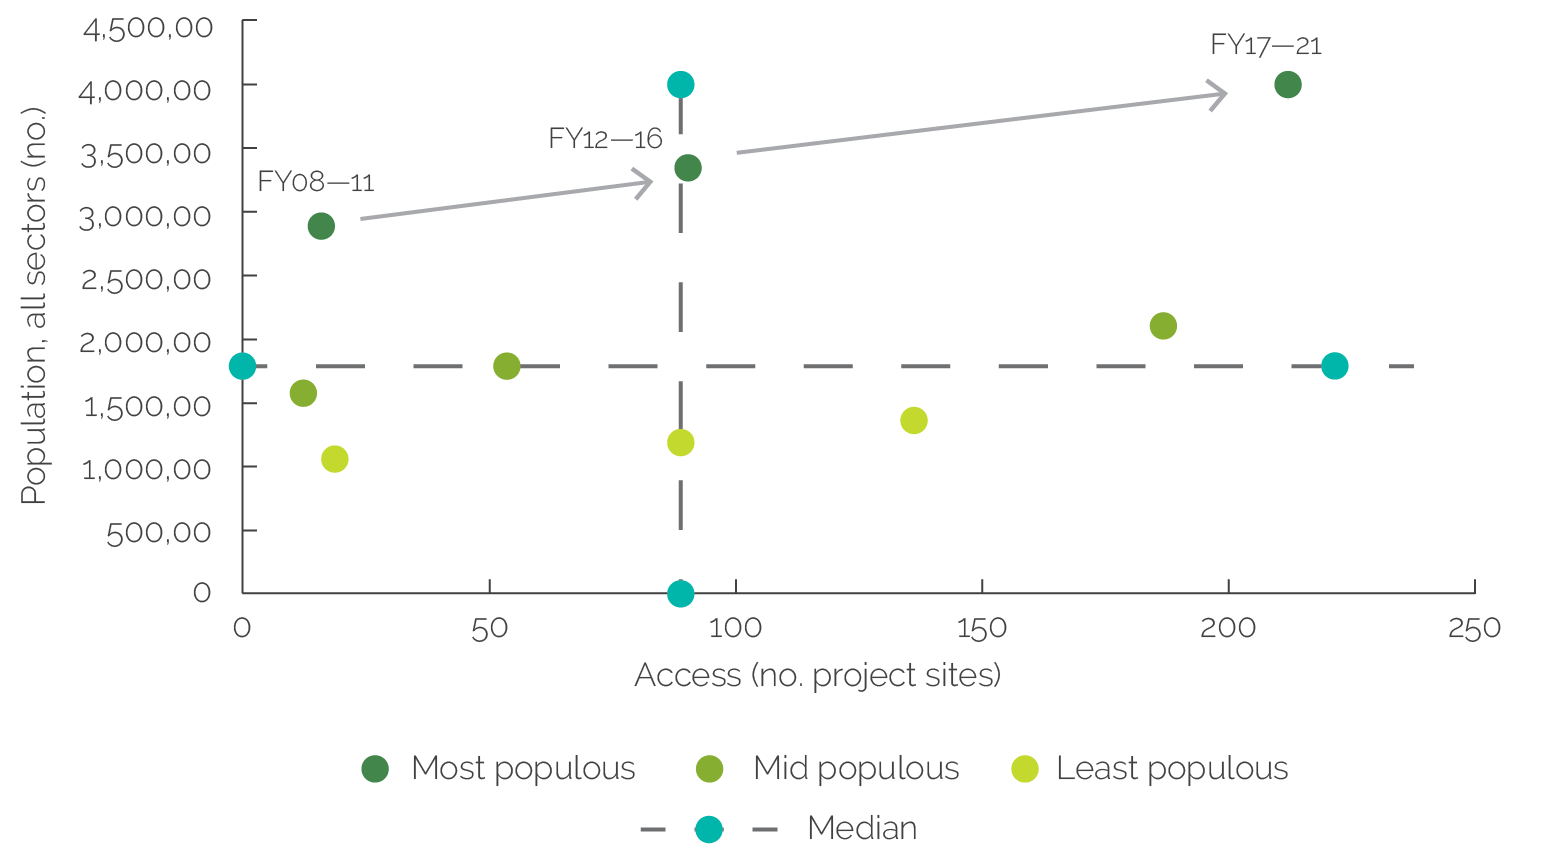
The analysis also grouped provinces into three income categories (highest, medium, and lowest) and three categories of population (most populous, medium, and least populous). Figure 4.2 shows the evolution of the World Bank’s support for those income categories. The dotted red line indicates the relationship between level of income (on the y-axis, proxied by income per capita) and level of World Bank support (x-axis, number of project locations). The figure shows a negative trend over time, with World Bank support becoming more concentrated in the poorest provinces. Similarly, figure 4.3 shows that the World Bank increasingly targeted the most populous provinces over the three strategy periods.
Figure 4.1. Distribution of Project Locations by Provincial Gross Domestic Product per Capita
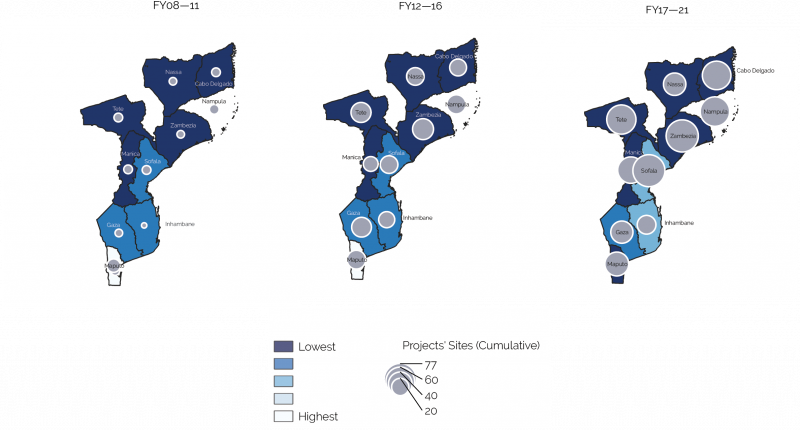
Figure 4.1. Distribution of Project Locations by Provincial Gross Domestic Product per Capita
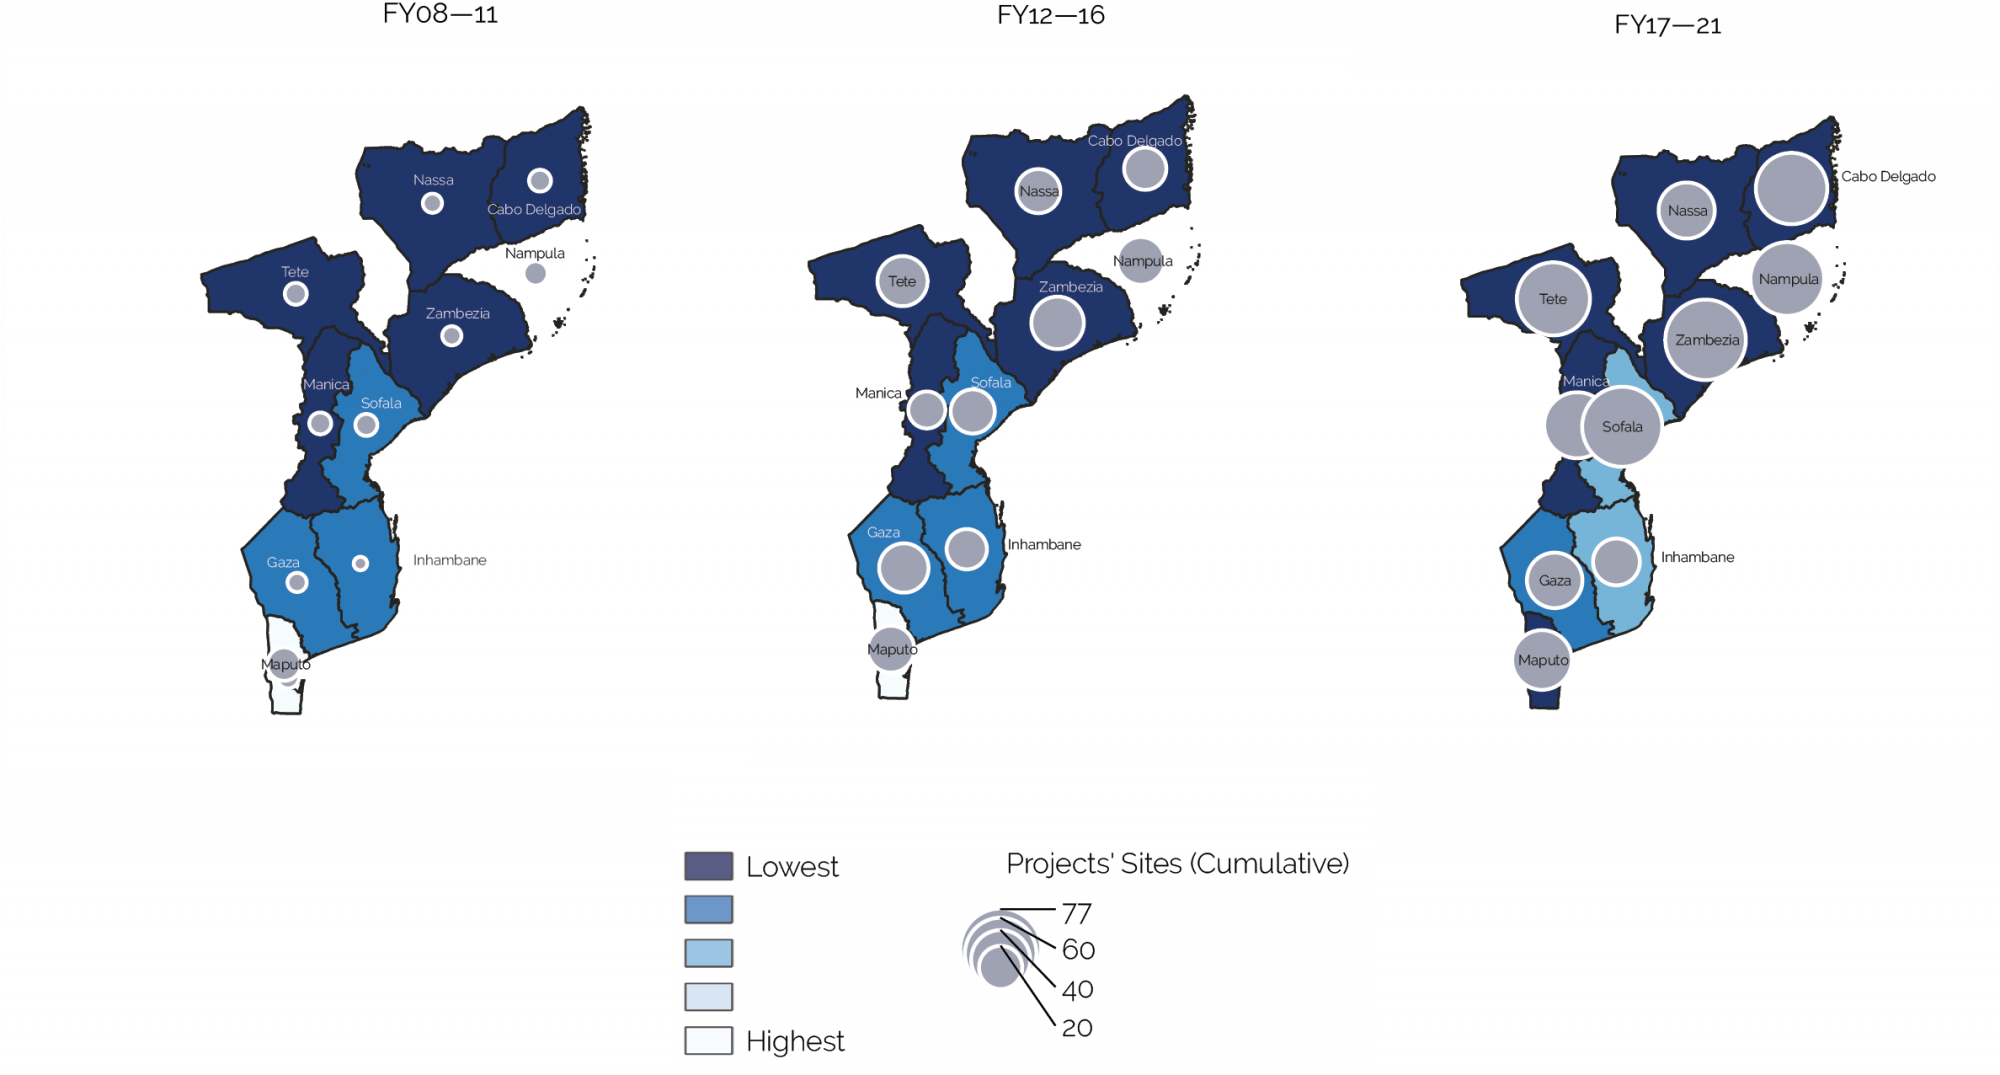
Source: Independent Evaluation Group calculations.
Note: Darker colors indicate lower level of income per capita. The size of the bubble includes new and open projects in each strategy period.
Figure 4.2. Correlation between Levels of World Bank Group Support and Need, by Strategy Period

Figure 4.2. Correlation between Levels of World Bank Group Support and Need, by Strategy Period
Source: Independent Evaluation Group calculations.
Note: FY = fiscal year; GDP = gross domestic product.
Figure 4.3. Targeting Trend by Population Share, by Strategy Period

Figure 4.3. Targeting Trend by Population Share, by Strategy Period
Source: Independent Evaluation Group calculations.
Note: FY = fiscal year.
Targeting of poorer provinces began earlier in the health and education sectors. The analysis also looked at the individual services using outcome indicators specific to each sector, such as level of illiteracy, access to health services, and access to transport and electricity. Provinces were divided into three groups based on need (highest, medium, and lowest), with the highest need defined as those provinces with the lowest levels of access. Social sectors (health and education) intentionally targeted poorer provinces already in the second period, while transport and electricity had a targeting of the poorest provinces in the latest period (figure 4.4; see appendix D).
Figure 4.4. Sector Targeting across Strategic Period

Figure 4.4. Sector Targeting across Strategic Period

Source: Independent Evaluation Group calculations.
Note: FY = fiscal year.
World Bank projects have progressively improved access to services across provinces. Project documents report the achievement of project objectives in most cases (table 4.3) and positive outcomes in education, health, transport, and (in part) electricity. In education, access to primary and secondary schooling surpassed targets, with net enrollment in grade 1 reaching 93 percent in 2019. At the same time, the pupil-teacher ratio improved in primary and secondary education, going from 72 to 1 in 2008 to 66 to 1 in 2010. Zambezia’s pupil-teacher ratio fell from 105 to 1 in 2006 to 82 to 1 in 2010. Primary and secondary participation rates for girls slightly improved over the same period, with the primary completion rate for girls increasing from 36.1 percent in 2007 to 45.8 percent in 2010. Similarly, the graduation rate for both male and female students surpassed the target, and between 2014 and 2018, the attendance rates of teachers and students improved because of increased supervision.
Projects exceeded targets for access to maternal health services, vaccinations, and immunization in targeted provinces. The percentage of institutional deliveries in Niassa, Nampula, and Cabo Delgado increased from a baseline of 51 percent in 2009 to 93 percent in 2017. The share of pregnant mothers who received a second dose of intermittent preventive treatment for malaria reached 70.3 percent in 2017, and in Cabo Delgado, Niassa, and Nampula, the percentage of children vaccinated with the pentavalent vaccine increased from a baseline of 45 percent in 2009 to 97.3 percent in 2017. In addition, during the FY12–15 period, the availability of selected drugs and medical supplies improved at key distribution points. The number of provinces achieving minimum compliance with standards increased from baseline zero in 2013 to 10 in 2018, compared with a target of eight provinces. The percentage of antiretroviral medications delivered to health facilities increased from 94.5 percent in 2011 to 98.6 percent in 2012 and to 100 percent in 2013 and 2014. However, a lack of routine data collection and endline surveys prevented a conclusive assessment on improvements in access to nutritional services in Cabo Delgado, Nampula, and Niassa. Partial data from two provinces suggest there were improvements.
In transport, despite problems with safeguard provisions and codes of conduct, World Bank support led to improved all-season access through the rehabilitation of roads. Under the Maputo Municipal Development Program II (approved FY11), 968,963 people in urban areas received access to all-season roads, from a baseline of 60,000 and with a target of 300,000. Improvements were the result of investment in secondary paved and unpaved roads in peri-urban areas and the rehabilitation of arterial roads. Operating expenses for road maintenance increased at the municipal level. World Bank investment projects in bridges and water passages contributed to better road networks in Nacala and Zambezia. In the Nacala Special Economic Zone, 41 bridges and water passages were rehabilitated and upgraded. The length of roads rehabilitated in the Zambezi Valley increased from 0 kilometers at the baseline (2013) to 207.6 kilometers by 2020 (only 7 kilometers short of the target of 215 kilometers).
In electricity, the World Bank was partially successful in increasing access in peri-urban and rural areas through both grid extension and application of off-grid solar photovoltaic solutions. However, World Bank support did not directly contribute to reductions in the frequency of electricity outages. The limited scope of World Bank activities was not consistent with improving access to modern energy services in a sustainable and affordable manner. The installation of a small number of improved wood-fuel stoves and solar water heaters in hospitals was not sufficient to increase access to modern energy services in peri-urban and rural areas.
Table 4.3. Project Ratings across the Evaluation Period
|
Sector |
Projects with Rating (no.) |
|||
|
Satisfactory |
Moderately satisfactory |
Moderately unsatisfactory |
Unsatisfactory |
|
|
Education |
1 |
2 |
0 |
0 |
|
Health |
1 |
2 |
0 |
0 |
|
Transportation |
0 |
3 |
0 |
1 |
|
Energy |
0 |
2 |
0 |
3 |
Source: Independent Evaluation Group.
Official statistics from a recent household survey confirm improved access to the four basic services for rural populations over the evaluation period. The latest household survey (2019–20) shows improvements in access to education, health, transportation, and electricity over the evaluation period (figure 4.5).
The World Bank helped reduce regional inequalities in access to basic services in each sector, although with different levels of success. Several improvements in the quantity and quality of education services were recorded, including improved access to primary and secondary schooling and increases in graduation rates and teacher-student ratios. Similarly, in health, World Bank projects facilitated access to vaccines and increases in institutional deliveries. In transport, World Bank–supported rehabilitation of roads and bridges eased access to transportation services; in electricity, World Bank support to grid extension and renewable energy improved access to electricity in underserved areas. To determine the extent to which these achievements have contributed to more equal access to services across provinces, IEG calculated a Gini coefficient–style inequality index for each of the sectors using higher-level outcome indicators, such as province-level literacy rates and share of province population with access to health, transport, and electricity services. Figure 4.6 shows that over the evaluation period, equality improved in all four sectors, providing further evidence of the World Bank’s contribution to shared prosperity in Mozambique. In education, the World Bank’s contribution was positive but marginal because in the two provinces with the largest populations (Nampula and Zambezia), the improvement rate in literacy was almost half the improvement in other provinces. Interviews with staff and donors confirm that high population growth rates made it challenging to meet the growing need for educational services.
Figure 4.5. Share of the Rural Population with Access to Basic Services

Figure 4.5. Share of the Rural Population with Access to Basic Services
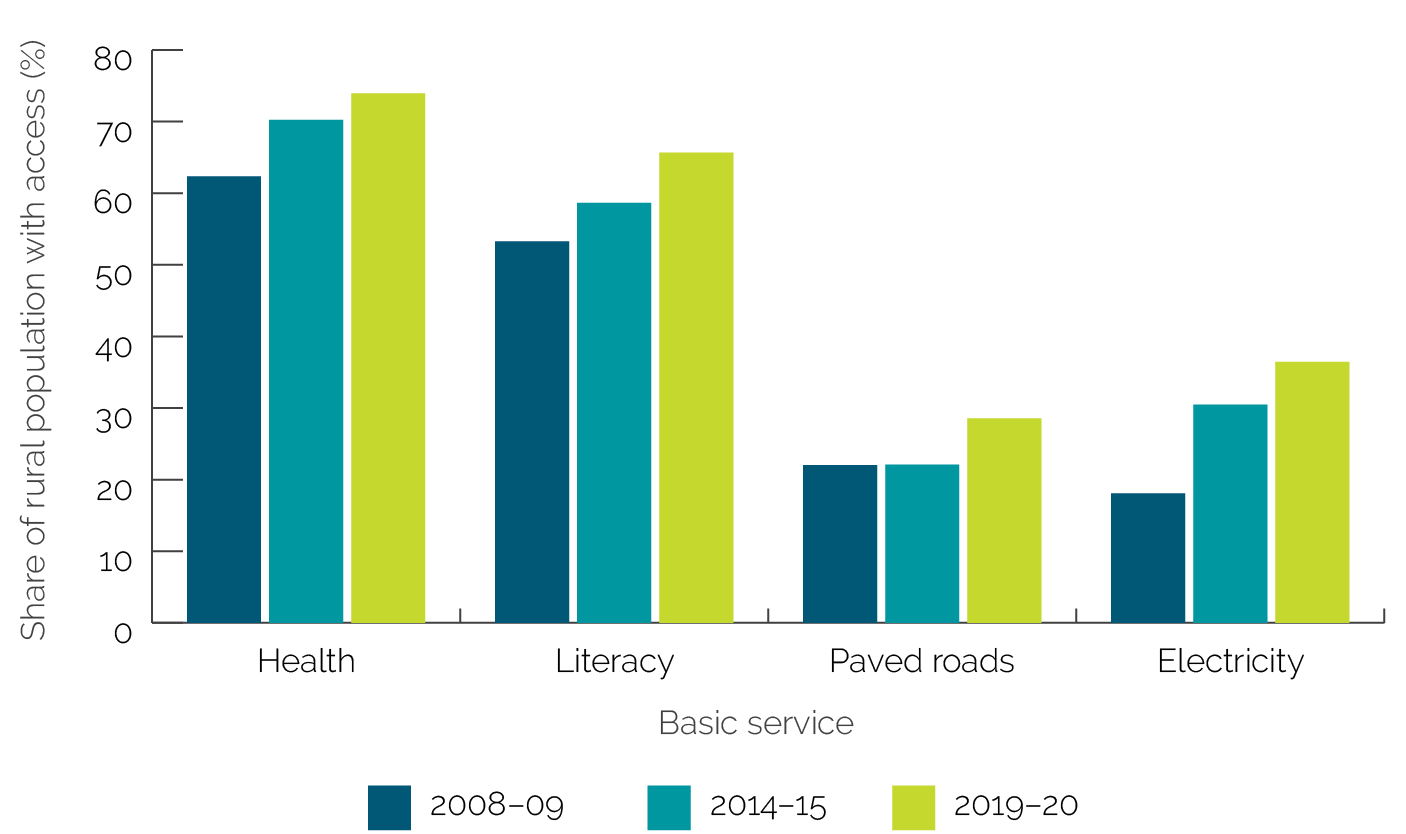
Source: National Statistical Office, various years.
Figure 4.6. (Gini-Style) Inequality Coefficients for Each Service across Strategy Periods

Figure 4.6. (Gini-Style) Inequality Coefficients for Each Service across Strategy Periods

Source: Independent Evaluation Group calculations using Inquérito sobre Orçamento Familiar 2019–20 data.
- Data sets included the following: Mozambique Multiple Indicator Cluster Surveys, Demographic and Health Surveys, National Household Surveys on Living Conditions, Population Census, Family Budget Household Surveys, National Institute for Social Security, physical infrastructure databases, and other sources such as nighttime lights data, along with the World Bank’s Education Statistics, the International Disaster Database, and the United Nations Educational, Scientific, and Cultural Organization.
- The analysis used only location as reported in project documents. Data on commitments by location were not available to be included in the analysis.