Results and Performance of the World Bank Group 2021
Chapter 3 | International Finance Corporation Results and Performance
IFC investments saw a recent improvement in ratings after years of decline. This uptick in ratings was possibly driven by changes in IFC’s portfolio composition and its recent efforts to strengthen XPSR work. More generally, various factors, such as project outcome types, are likely to have influenced IFC’s longer-term investment ratings trend.
Recent Investment Ratings Improvements
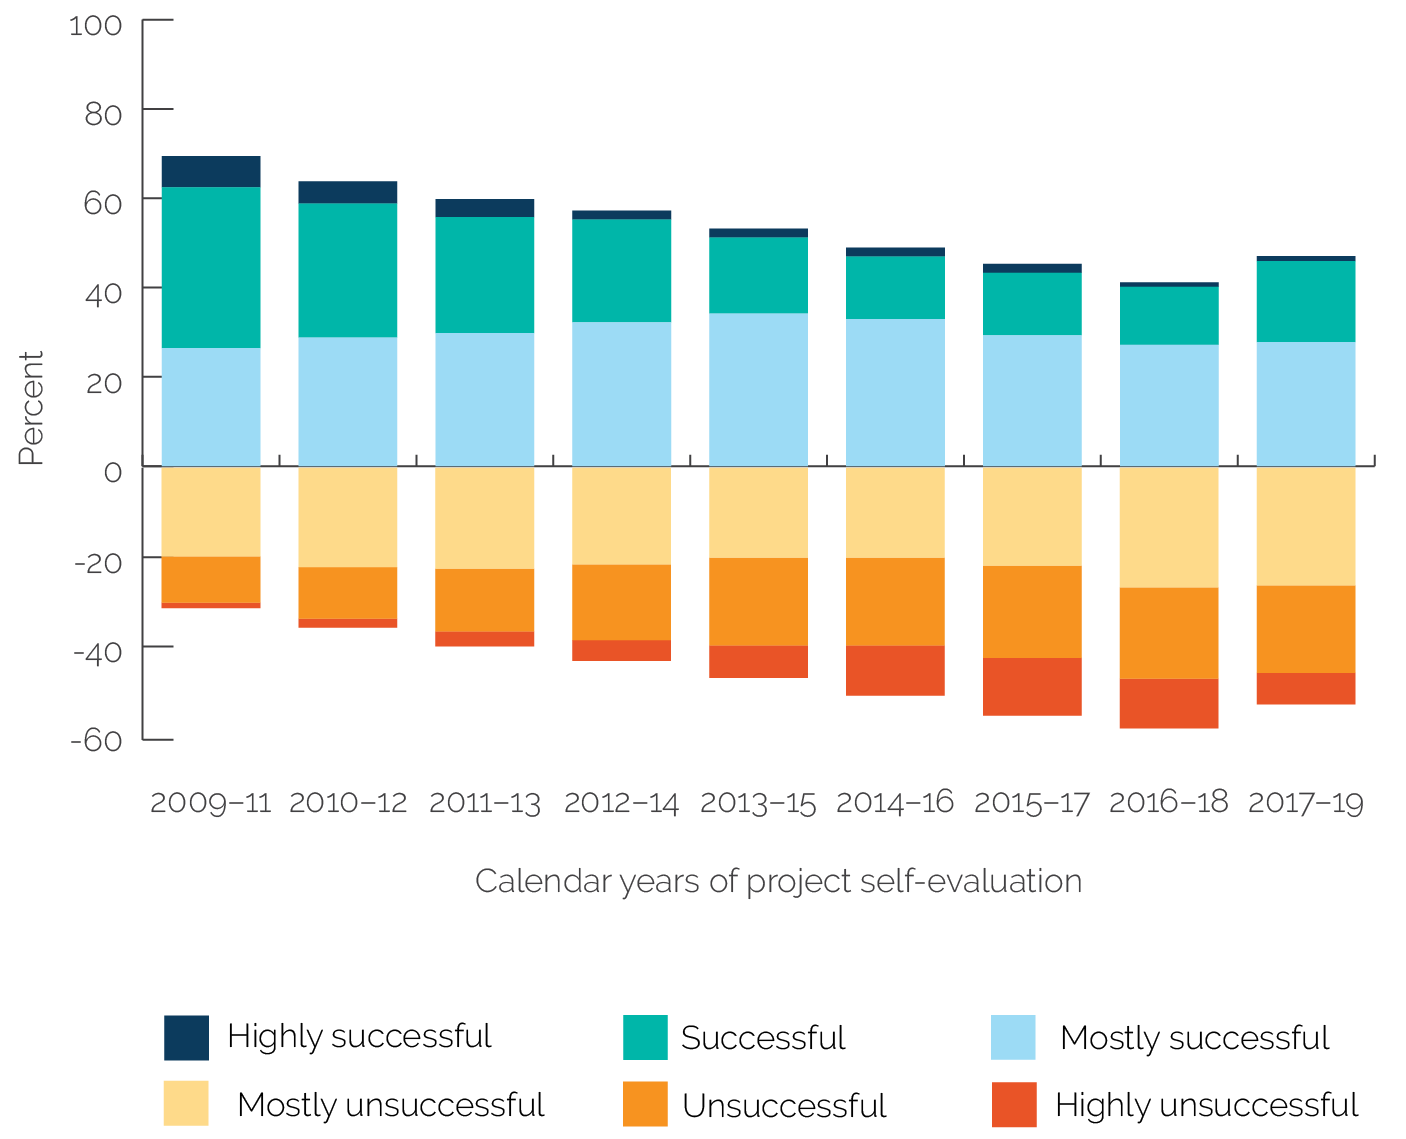
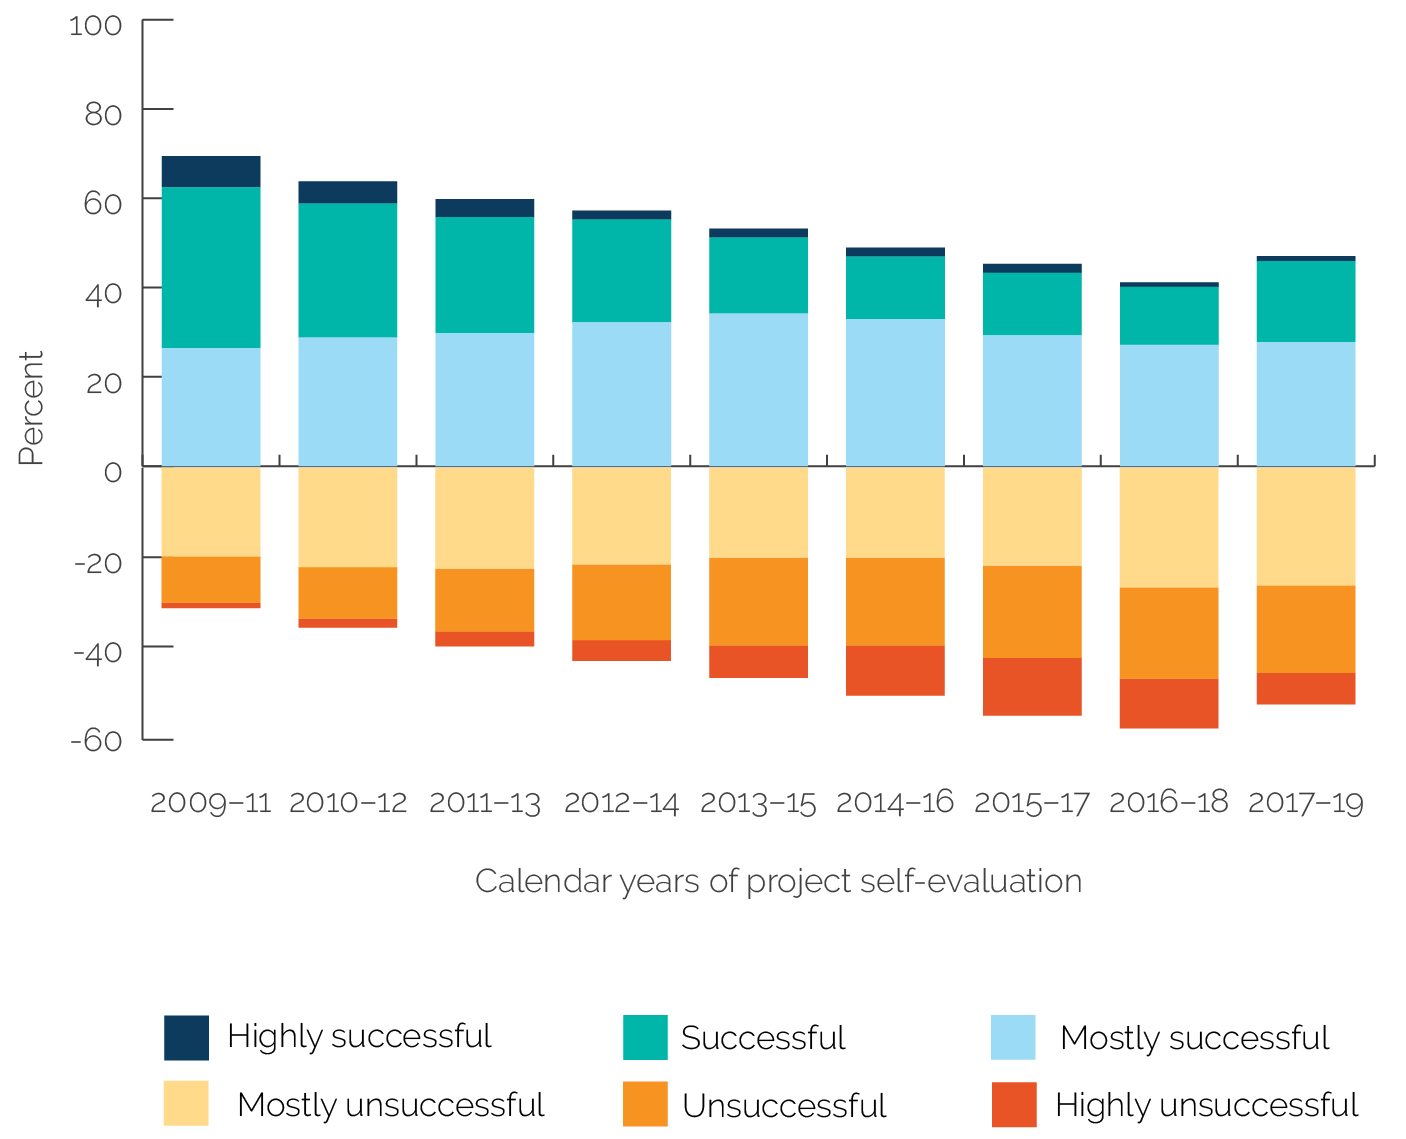
IFC’s overall development outcome ratings for investment projects improved recently after years of decline. IFC ratings are determined in XPSRs in a process that first involves IFC’s self-evaluation of IFC investments. The self-evaluation is then validated by IEG using an EvNote.1 For projects that close before sampling for evaluation, IEG prepares a Project Evaluation Summary (PES) in lieu of an XPSR.2 The XPSR examines a project’s business, economic, environmental, and social performance and its contribution to private sector development in the country. As shown in figure 3.1, IFC’s development outcome ratings were declining in XPSRs until CY16–18, when 42 percent of projects were rated mostly successful or better (MS+). When measured annually, the overall development outcome success rate was its lowest in CY17, at 41 percent. This decline coincided with IFC’s expansion to new clients, difficult countries, and more complex projects. In addition, these sets of projects evaluated during the period of decline included those projects approved during the global financial crisis of 2008–10.3 However, IFC’s investment performance has improved since 2018. IFC investment projects’ development outcome ratings reversed their declining trend from the past 10 years, improving to 47 percent MS+ (by the number of projects) and 50 percent MS+ (by the net commitment volume) on a three-year rolling basis in CY17–19 (figure 3.1). IFC’s annual overall development outcome success rate improved by 18 percentage points to 60 percent in CY19. In addition, as shown in figure 3.2, the share of successful projects increased, and the share of highly unsuccessful projects shrunk. It should be noted that the preliminary trends (from a still incomplete sample of validated projects) for CY20 indicate that the overall development outcome success rate might be lower than it was in CY19, so the recent rating uptick may not be sustained. Evaluations of projects affected by COVID-19 have not yet been included in the CY19 cohort.
Figure 3.1. IFC Investment Project Development Outcome Ratings

Source: Independent Evaluation Group.
Note: IFC = International Finance Corporation; MS+ = mostly successful or better; XPSR = Expanded Project Supervision Report.
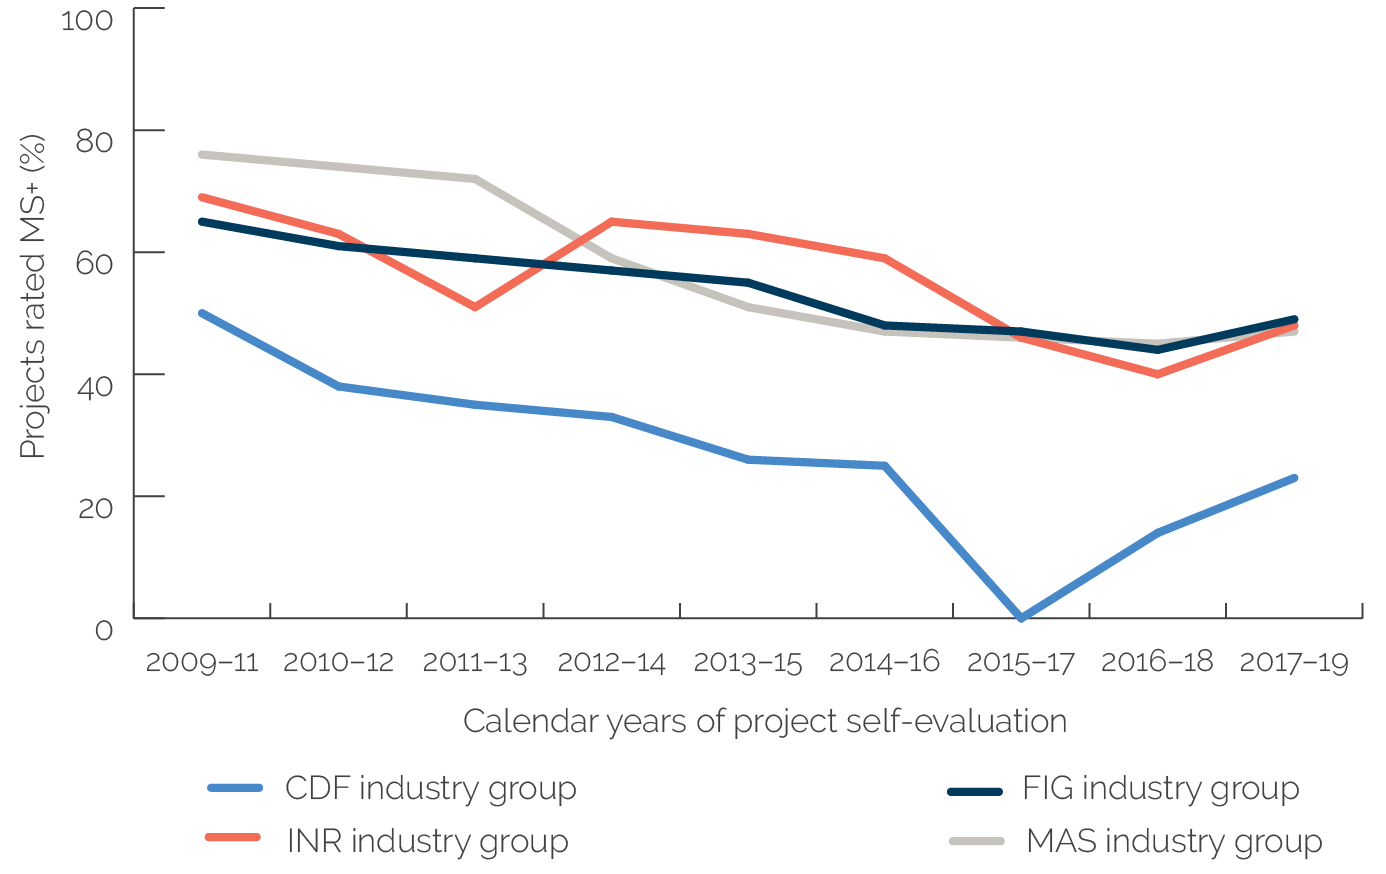
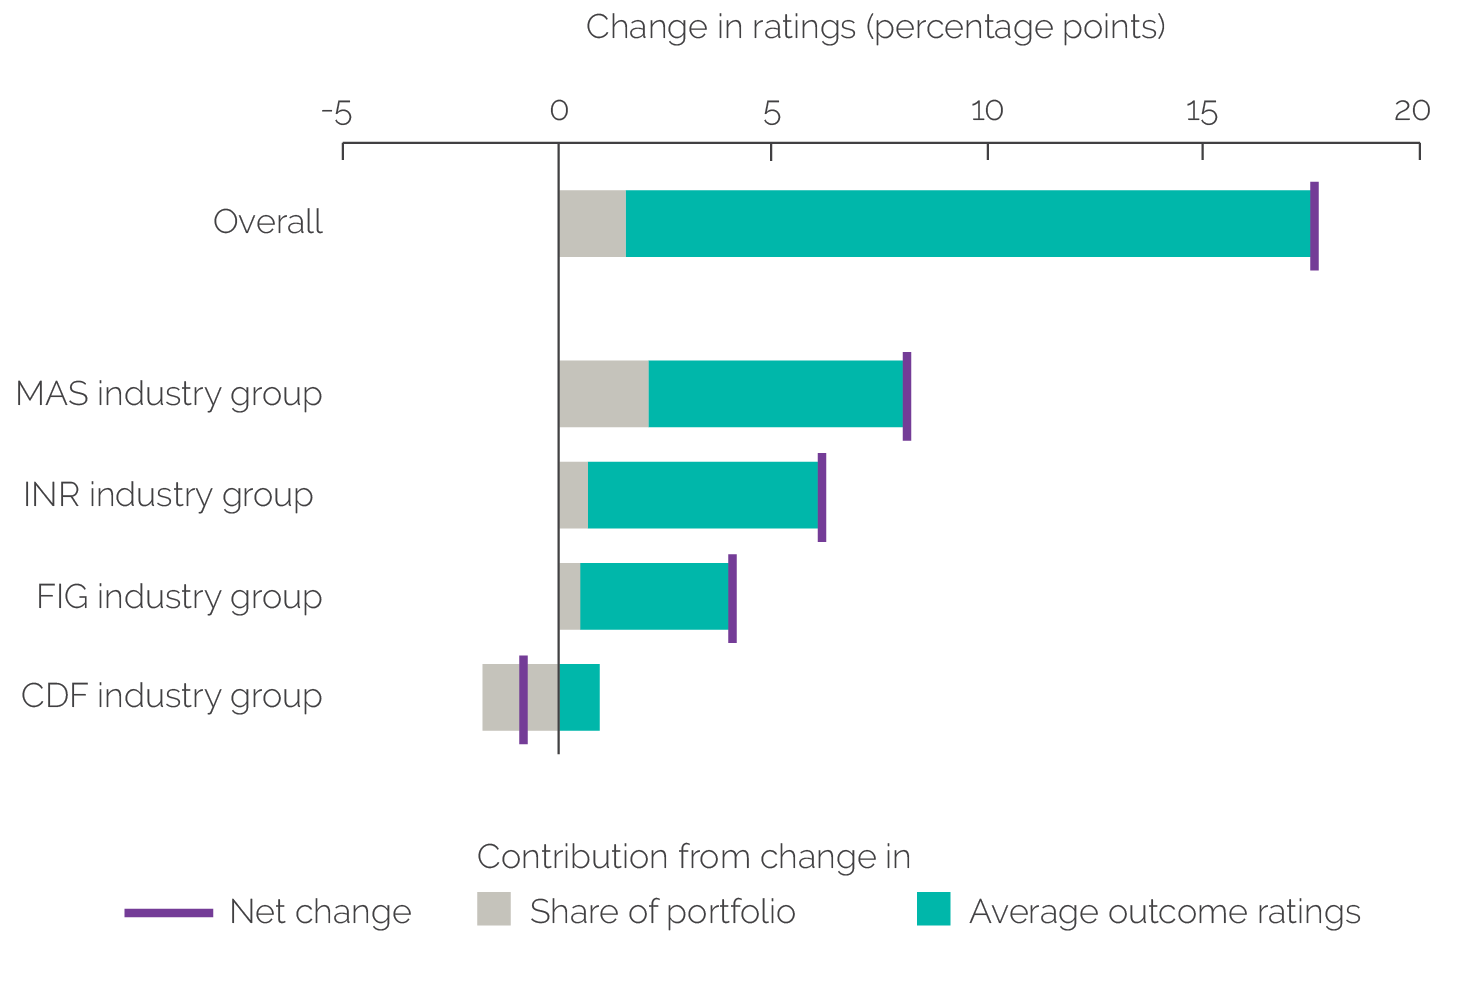
Three out of IFC’s four industry groups show a similar trend of improved ratings (figure 3.3). Projects in three of IFC’s four industry groups—the Financial Institutions Group, Infrastructure, and Manufacturing, Agribusiness, and Services—had their lowest development outcome success rates of 45, 39, and 44 percent for CY16–18, before improving to 50, 48, and 47 percent in CY17–19. The fourth industry group—Disruptive Technologies and Funds—had the lowest development outcome success rate of 0 percent in CY15–17 (although this was a very small sample of projects) before substantially improving to 23 percent in CY17–19 (figure 3.3). On an annual basis, Financial Institutions Group, Infrastructure, and Manufacturing, Agribusiness, and Services showed increasing trends from CY18 to CY19, with success rates (MS+) of 57, 68, and 57 percent. A decomposition analysis for IFC projects confirms these findings. Most industry groups, except Disruptive Technologies and Funds, increased their shares between CY18 and CY19, but it was the increased success rate for all the industry groups that contributed most to the uptick (figure 3.4). For the whole decomposition analysis, please see appendix D.
Figure 3.2. Distribution of IFC Development Outcome Ratings
Source: Independent Evaluation Group.
Note: IFC = International Finance Corporation.
Figure 3.3. IFC’s Investment Project Development Outcome Ratings by Industry Group

Source: Independent Evaluation Group.
Note: CDF = Disruptive Technologies and Funds; FIG = Financial Institutions Group; IFC = International Finance Corporation; INR = Infrastructure; MAS = Manufacturing, Agribusiness, and Services; MS+ = moderately satisfactory or above.
Well-known factors that influence investment performance likely continued to influence IFC’s recent ratings trends. Previous RAPs identified factors that have contributed to declining trends over the years. The RAP 2020, in particular, identified internal work quality issues, external risks, and broader market trends as factors that drive IFC’s investment project ratings. Meanwhile, a 2017 joint IFC-IEG study on IFC’s work quality on investment projects identified staffing, incentives, diffused accountability, IFC’s organizational culture, and IFC’s focus on volume targets over development results as the main factors affecting IFC’s investment work quality. IEG’s review of project validations found that sponsor risks, market risks, country risks, and transaction structuring factors are clearly associated with IFC’s investment project performance. IFC’s efforts to partner with repeat clients are meant to address the sponsor risk (see box 3.1.) Broader market trends, including a weaker pool of viable investment projects, have exposed IFC to higher risks, which are hard to completely mitigate and may influence ratings. This RAP did not carry out an in-depth assessment on the impact of these well-known factors on the ratings increase from CY19, but it is likely they played a role.4
Figure 3.4. Decomposition Analysis of the Increase in IFC Development Outcome Ratings by Industry Group (change between Calendar Years 2018 and 2019)

Source: Independent Evaluation Group.
Note: CDF = Disruptive Technologies and Funds; FIG = Financial Institutions Group; IFC = International Finance Corporation; INR = Infrastructure; MAS = Manufacturing, Agribusiness, and Services.
Box 3.1. Working with Repeat Clients
Projects that worked with repeat clients showed higher ratings. Previous Results and Performance of the World Bank Group reports, Independent Evaluation Group (IEG) evaluations, and synthesis analyses showed that repeat clients reduced sponsor selection risks and had a positive impact on project performance and development outcome ratings. According to an IEG evaluation on the International Finance Corporation’s (IFC) client engagement, 70 percent of projects with repeat clients were rated mostly successful or better, compared with 49 percent for IFC’s one-off clients (World Bank 2018a). Higher performance mainly reflects a selection effect, since IFC is more likely to continue to engage with relatively stronger clients with a track record of implementing projects successfully and better fit with IFC’s strategic focuses.
Working with repeat clients would provide opportunities for IFC to leverage these relationships to enhance project ambition and maintain good performance. IEG analyses show that IFC’s support and contribution to repeat clients could evolve during the engagement and exhibit a life cycle in which clients at some point outgrow the need for IFC’s services. The analyses show that there were cases where IFC’s first intervention with a client introduced new or better standards in corporate governance, environmental and social performance, or other areas, whereas the second intervention with the same client developed knowledge and innovation or expanded investments to different countries, unknown territories, higher-risk areas, or higher-risk markets, such as those in International Development Association countries and countries with fragile and conflict-affected situations. The need for IFC to maintain additionality throughout this life cycle in client relationships has implications for IFC’s future selection and segmentation of clients. However, according to the IEG reports, there was no established pattern of these incremental additionalities, and ensuring additionality in follow-on projects remains a challenge. The IEG evaluation on IFC’s client engagement called for strengthening criteria for additionality for strategic clients, including for the justification of incremental additionality (World Bank 2018a). IEG evaluations also emphasize the need for IFC to constantly renew and expand its client pool. For example, given the limited number of clients in fragile and conflict-affected situations that meet IFC standards, a recent IEG evaluation on IFC’s and the Multilateral Investment Guarantee Agency’s support for private investment in fragile and conflict-affected situations indicates that to increase business in those countries, IFC needs to broaden its client base to reach and build the capacity of local and regional private investments (World Bank, forthcoming).
Source: Independent Evaluation Group; World Bank, forthcoming.
IFC’s efforts to address these factors may have paid off in the recent ratings improvements. In the past few years, IFC created the Economics and Private Sector Development Vice Presidential Unit to strengthen its project and macroeconomic analyses, launched the AIMM framework, and strengthened the Accountability and Decision-Making Framework. IFC’s management has improved the quality of self-evaluations, including investment projects’ XPSRs and advisory services projects’ Project Completion Reports (PCRs), and engaged more proactively in reviewing IEG’s EvNotes and PESs. These combined efforts led to IFC management providing targeted, expert advice to improve project analyses and help articulate project outcomes, including a project’s development impact, in the XPSRs and PCRs. These efforts also facilitate the processing and effective management of XPSRs, PESs, and PCRs. It is possible, but not confirmed, that some of these efforts may be reflected in the recent ratings uptick. For example, after management’s push to improve XPSRs, the share of XPSRs nominated as best practices increased from 12 percent in 2016, 11 percent in 2017, and 10 percent in 2018 to 20 percent in 2019.
These efforts increased the dialogue between IFC and IEG on project self-evaluations and reduced IEG-IFC ratings variance. As a result, the share of EvNote and PESs to which IFC provided comments increased from 74 to 84 percent from CY16 to CY19. More important, the quality of the responses and information provided by clients increased substantially, in IEG’s view. These improvements prompted additional dialogue between IFC and IEG, which resulted in enhanced learning on both sides and reduced ratings variance between the two groups. During the XPSR evaluation process, IFC’s self-rating and IEG’s validation rating often differ; this is referred to as ratings variance. The increased dialogue between IFC and IEG, enhanced by joint training on self-evaluation and support from experts, built a common understanding by both groups of self-evaluation guidelines, facilitated the collection of quality evidence, and improved the objective assessments of project performance. All of these efforts helped reduce the ratings variance from 31 percent in CY17 to 8 percent in CY19.
Recent IEG Sector Highlights and validation exercises have shed light on what factors contributed to the recent ratings improvement. Financial Institutions Group’s Sector Highlights, carried out in FY21, identified several high-probability (frequency) and high-impact (severity) risks that were common in low development outcome ratings. These risks include business, economic, foreign exchange, management, and corporate governance risks. Manufacturing, Agribusiness, and Services’s Sector Highlights, carried out in FY20 and focused on the agribusiness portfolio, took a similar approach and discovered that (i) project, country, or macro factors influenced projects from previous years, but diminished as factors for more recent projects as the impact of the 2008–10 financial crisis subsided; (ii) market risks related to prices and competition were associated with negative outcomes in agribusiness projects, more than in other Manufacturing, Agribusiness, and Services projects; and (iii) sponsor and management quality were important factors for both successful and failed projects.5 IEG’s validations of Infrastructure’s CY19 projects found that many factors positively influenced ratings, including transaction structuring aspects, a sponsor or company’s management capacity, a company’s stronger competitiveness in the market, and a favorable political or regulatory environment. Meanwhile, changing dynamics in the market and macroeconomic situations, such as currency depreciation, negatively influenced ratings.
In CY19, IFC’s subsector composition had fewer poorly performing clients, which contributed to the improvement of overall development outcome ratings. In Infrastructure, there were fewer platform companies in the power sector, junior miners in the mining sector, and nonmobile telecom clients in the telecom, media, and technology sectors. These types of clients tend to have lower ratings than other clients. In Manufacturing, Agribusiness, and Services, fewer retail, tourism, construction, and real estate projects (whose performance declined in CY19), combined with more agribusiness and manufacturing projects (whose performance improved in CY19), contributed to IFC’s aggregated improved ratings.
For the Financial Institutions Group, the lower share of greenfield projects and improved ratings of projects in Europe and Central Asia contributed to positive results in CY19 compared with previous years. Greenfield projects are projects that finance new ventures and activities.6 Historically, greenfield projects have lower development outcome ratings than mature projects because they take more time to deliver results and many things can go wrong, although careful structuring and close supervision can help reduce or mitigate the risks. Another factor behind Financial Institutions Group’s improved performance was a slight improvement in recent years of development outcome ratings in Europe and Central Asia. However, the increasingly unstable economic environments since 2019, which include political instability and geopolitical conflicts, could affect investor sentiments and market performance.
Longer-Term Investment Rating Trends
IFC’s ratings have generally declined over the past 10 years, a trend that differs from the ratings uptick in CY19. This section explores some potential influences on these longer-term ratings trends. This analysis shows that characteristics such as market-level outcome types and a project’s development potential may contribute to changes in ratings. This chapter’s analysis relies on a combination of AIMM, XPSR, and EvNote data, which box 3.2 describes.
Box 3.2. Analysis of IFC’s Outcome Types and Outcome Potential
This chapter uses the Anticipated Impact Measurement and Monitoring (AIMM), Expanded Project Supervision Report (XPSR), and Evaluation Note (EvNote) frameworks for project performance data. The Results and Performance of the World Bank Group (RAP) report’s objective was to use these data to analyze the impact on ratings of International Finance Corporation (IFC) outcome types and outcome potential. As in the chapter 2 analysis, outcome types refer to the outcomes that project activities pursue. The RAP defined 13 outcome types for IFC projects. Outcome potential, which is unique to IFC, refers to the magnitude of the development challenge that a project is going to address in a given country or sector and the intensity or extent to which these efforts contribute to those development challenges. XPSRs and EvNotes provide evaluation ratings data for projects, whereas AIMM provides additional data on outcome types and outcome potential, which are not measured by XPSRs and EvNotes. In other words, we use AIMM data to supplement XPSR and EvNote data. However, IFC only introduced the AIMM framework in 2017. Therefore, this RAP had to review the projects to which IFC retroactively applied AIMM data (“backfilled projects”), whose approval predates the introduction of the framework, and fill in missing XPSR and EvNote ratings. The Independent Evaluation Group has not yet evaluated or validated the projects that applied AIMM at approval; therefore, these projects were excluded from this RAP ’s sample of IFC projects. As a result of these various frameworks and the need to rely on projects with backfilled AIMM data, IFC’s project results and the Independent Evaluation Group’s findings from the outcome type and outcome potential analyses should be interpreted cautiously.
Methodology for outcome type analysis. The outcome types defined for this exercise capture the type of change envisioned by project objectives. For IFC, we defined an outcome typology that includes 13 outcome types based on the AIMM sector framework. We analyzed outcome types for all projects that had AIMM monitoring results based on backfilled AIMM and in XPSRs validated between fiscal year (FY)12 and the first half of FY20. We carried out our own assessment on outcome claim achievement by reviewing XPSRs and EvNotes, complemented with AIMM intensity and movement ratings for outcome claims at the approval and monitoring stages. Appendixes A and B provide further details.
Methodology for outcome potential analysis. To assess the relationship between projects’ outcome potential and their XPSR rating, we used AIMM potential ratings (both at the approval and monitoring stages) for AIMM’s two dimensions—project outcome and market outcome, with XPSR’s ratings for economic sustainability and private sector development, two of XPSR’s four dimensions. Although AIMM and XPSRs assess similar elements for their corresponding dimensions (such as project outcome and economic sustainability or market outcome and private sector development), the ways these outcomes are assessed differ between AIMM and XPSR because they serve different purposes: AIMM is an ex ante and monitoring framework and XPSR is an evaluation framework. To build the cohort, we used the same projects used for the outcome type analysis. Appendix A provides additional details.
The outcome type analysis and the outcome potential analysis are based on the early-stage implementation of AIMM framework and projects with backfilled AIMM data. Therefore, as mentioned above, their findings and implications should be interpreted cautiously.
Source: Independent Evaluation Group.
Note: IFC = International Finance Corporation.
According to AIMM’s analytical framework, IFC’s project outcomes fall into two broad categories—project-level claims and market-level claims. Project-level claims, or outcomes, are defined as a project’s direct and indirect effect on stakeholders, the economy, and the environment. Market-level claims are derived effects, defined as a project’s ability to catalyze systemic changes beyond those brought about by the project itself. Overall, all of the reviewed IFC projects had project-level claims and 86 percent had market-level claims. Furthermore, IFC projects focused on two outcome types the most, with 68 percent pursuing the project-level claim “improved access to goods and services,” and 53 percent pursuing the market-level claim “increased market competitiveness.”
Projects are less likely to achieve market-level claims, particularly competitiveness in the market, than project-level claims.7 The “competitiveness,” “integration,” and “sustainability” market-level outcome types have the lowest achievement rates of all outcome types, at 36 percent, 43 percent, and 38 percent (table 3.1). Among the project-level outcome claims, access to goods and services shows a relatively low success rate. Market-level outcome types also have a larger share of downgraded AIMM claim ratings than project-level outcome types.
These results show that it is more difficult for IFC to achieve and measure market-level outcomes than project-level outcomes. This is because the success of market-level outcomes depends on the broader market environment and external factors such as market changes and actions by external actors, including government officials or private companies. Also, measuring market-level outcomes is challenging because of the long-term time horizons for outcomes to materialize, the challenge of attributing market-level results to IFC-supported projects, fewer good indicators to measure projects’ contribution with certainty, and the minimal impact that an individual IFC project can have on the broader market. 8, 9 By contrast, project-level outcomes have shorter time horizons and often provide goods, services, financing, or infrastructure, all of which IFC and its counterparts have more control over achieving. Also, these outcome types tend to have more accurate and attributable evidence to use for monitoring performance. That is not to say that project-level outcomes are not challenging in their own way. For example, “access to goods and services for MSMEs [micro, small, and medium enterprises]” has a relatively lower achievement rate and larger variance in change ratings. This outcome type requires expanded lending to micro, small, and medium enterprises, enabling them to borrow from financial institutions, which is not entirely within the control of the project, either. Also, project-level outcomes may be just as risky as market-level outcomes. Our methodologies used variance, or the change in outcome-claim level AIMM ratings between the approval and monitoring stages, as a measure of risk and uncertainty. “Access to goods and services,” for example, is a project-level outcome that shows a relatively large variance in claim rating changes.
Table 3.1. Outcome Type Performance and Performance Changes from the Approval Stage to the Monitoring Stage, 2012–20
|
Claim Type |
Outcome Claims |
Change in Claim Rating (%) |
|||||
|
(% achieved) |
(no.) |
−2 |
−1 |
0 |
+1 |
+2 |
|
|
Project-level claim |
|||||||
|
1.1 Access to goods and services (1.1.1–1.1.3) |
51 |
193 |
4 |
22 |
63 |
10 |
1 |
|
1.1.1 Access to goods and services (MSME) |
51 |
97 |
5 |
27 |
57 |
11 |
0 |
|
1.1.2 Access to goods and services (female) |
71 |
14 |
8 |
8 |
62 |
15 |
8 |
|
1.1.3 Access to goods and services (customers) |
53 |
97 |
2 |
15 |
73 |
10 |
0 |
|
1.2 Quality/affordability of goods and services |
63 |
16 |
13 |
13 |
67 |
7 |
0 |
|
2.1 Suppliers/distributors reached |
68 |
25 |
0 |
18 |
73 |
9 |
0 |
|
2.3 Improved sales/profitability of suppliers/distributors |
66 |
29 |
0 |
16 |
76 |
8 |
0 |
|
3.1 Increased employment |
57 |
56 |
2 |
16 |
73 |
9 |
0 |
|
6.2 GHG reduction |
70 |
30 |
0 |
23 |
77 |
0 |
0 |
|
Market-level claim |
|||||||
|
9. Competitiveness in the market |
36 |
126 |
10 |
19 |
67 |
5 |
0 |
|
10. Resilience in the market |
63 |
24 |
4 |
26 |
70 |
0 |
0 |
|
11. Integration in the market |
43 |
28 |
11 |
11 |
75 |
4 |
0 |
|
12. Inclusiveness in the market |
69 |
16 |
6 |
38 |
44 |
13 |
0 |
|
13. Sustainability in the market |
38 |
13 |
0 |
46 |
54 |
0 |
0 |
Sources: Independent Evaluation Group and International Finance Corporation.
Note: (i) Of project-level outcome claims considered not achieved, 25 percent were considered not achieved because their results could not be verified. Of market-level outcome claims considered not achieved, 57 percent were considered not achieved because their results could not be verified. The relatively high percentage of nonverified market-level outcomes was partly due to the fact that many of those market outcomes were identified retroactively with backfilled Anticipated Impact Measurement and Monitoring frameworks. Monitoring of outcome results, particularly of market-level outcome, may improve under the Anticipated Impact Measurement and Monitoring framework. (ii) “Change in Claim Rating” means step changes of intensity (project claims) or movement (market claims) ratings for claims from ex ante to monitoring. GHG = greenhouse gas; MSME = micro, small, and medium enterprise.
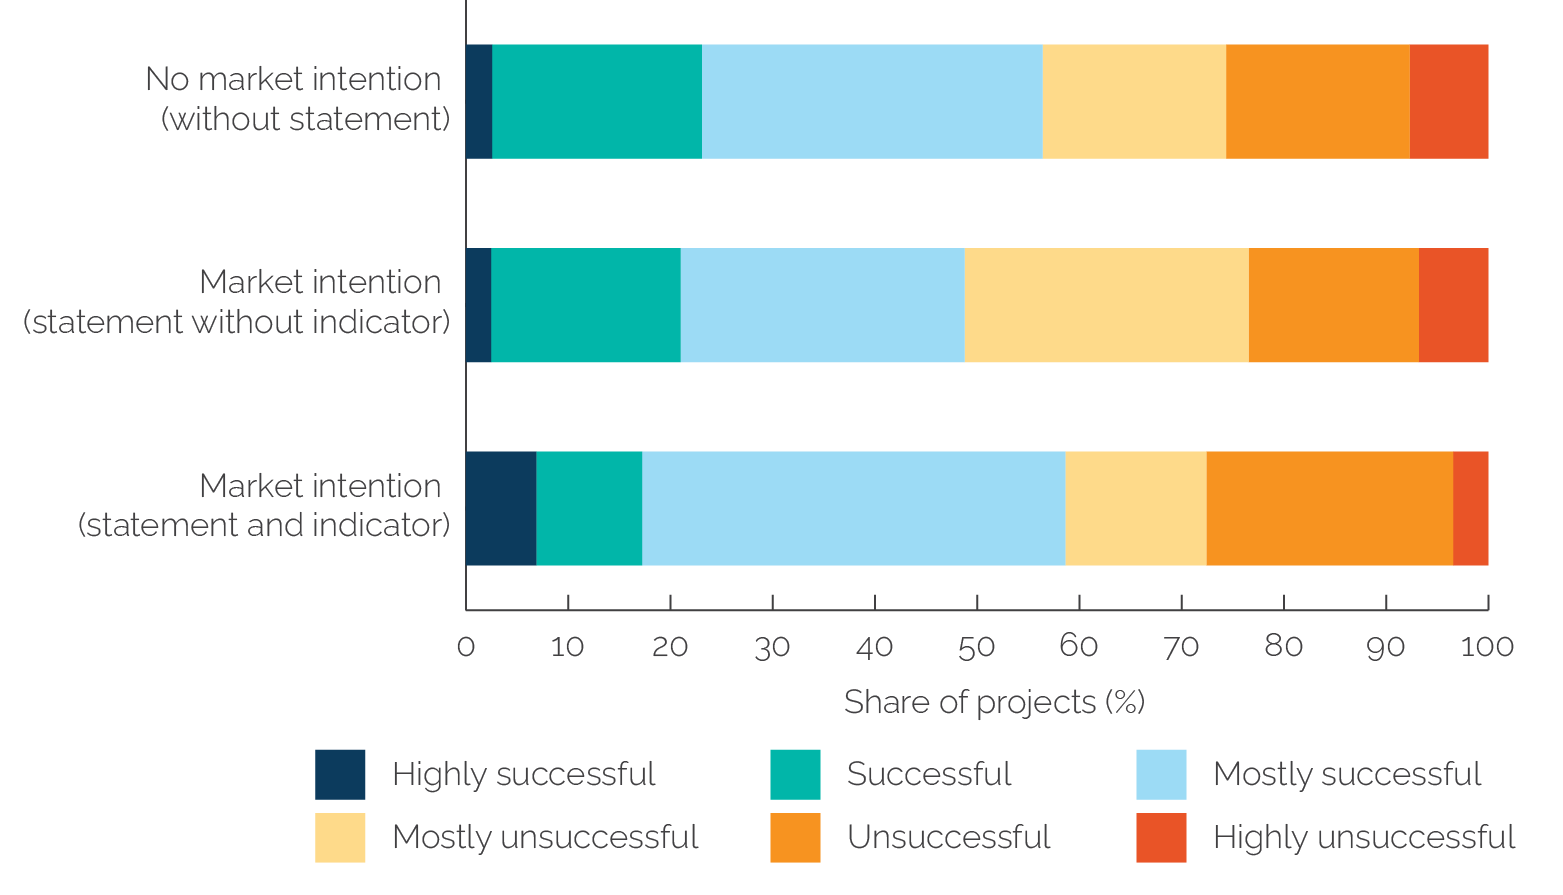
Projects that had market-level claims at approval did not necessarily end up with lower project-level ratings, partly because of different evaluative approaches. We assessed how project development outcomes that intended to achieve a market impact were rated by XPSR.10 The results indicate that projects with market-level intentions had XPSR ratings similar to those of projects without a market-level intention (table 3.2). Moreover, the variability of XPSR ratings for projects with market intentions does not seem to be particularly high compared with XPSR ratings for projects without market intentions (figure 3.5). One reason for this is the XPSR evaluation approach. For example, XPSRs account for the achievement of not only expected market outcome claims but also various other elements such as (i) the performance of relevant competitors and industry benchmarks in the prevailing macroeconomic environment; (ii) other unintended outcomes in private sector development; and (iii) business performance, economic sustainability, and environmental and social effects. Therefore, if a project does not achieve a market-level claim, it does not automatically mean that the project’s development outcome will be low in XPSR. At the same time, if a project achieves a transformational market impact, it may be properly reflected by a higher private sector development rating. Refer to box 3.3 for some examples of projects with substantial market impact.
Table 3.2. AIMM and XPSR Ratings of Projects with Market-Level Outcome Intentions
|
Market Intention |
AIMM Ex Ante Score (avg.) |
XPSR DO (avg.) |
HS |
S |
MS |
MU |
U |
HU |
|
1. No market intention (without statement) |
26.0 |
3.5 |
1 |
8 |
13 |
7 |
7 |
3 |
|
2. Market intention (statement without indicator) |
40.6 |
3.4 |
4 |
30 |
45 |
45 |
27 |
11 |
|
3. Market intention (statement and indicator) |
45.2 |
3.5 |
2 |
3 |
12 |
4 |
7 |
1 |
Source: Independent Evaluation Group.
Note: avg. = average; AIMM = Anticipated Impact Measurement and Monitoring; DO = development outcome; HS = highly successful; HU = highly unsuccessful; MS = mostly successful; MU = mostly unsuccessful; S = successful; U = unsuccessful; XPSR = Expanded Project Supervision Report..
Figure 3.5. Distribution of XPSR Ratings by Project Market Intention

Source: Independent Evaluation Group.
Note: XPSR = Expanded Project Supervision Report.
Box 3.3. Examples of IFC Investment Projects with Market Impacts
Providing sustainable energy financing in Lebanon. The International Finance Corporation provided $10 million to expand the sustainable energy finance (SEF) portfolio of a commercial bank in Lebanon. It also provided advisory services to the bank to assess risk and develop and market SEF products in Lebanon. As a result, the bank successfully expanded its SEF portfolio, which led to multiple repeat transactions with this bank and other financial institutions in the country and created a new market for climate change financing and SEF lending. All of this eventually led to the issuance of the first green bond in Lebanon and the Levant region.
Developing the first mobile virtual network operator in Chile. The International Finance Corporation provided a $11 million C loan in Chile to launch and operate a mobile virtual network operator (MVNO)—a wireless communications provider that does not own the wireless network infrastructure. The MVNO primarily targeted Chilean youth. The project was the country’s first MVNO, thereby having a strong demonstration effect, leading to seven more MVNOs launching in Chile. The multiple MVNOs in the country increased competition among mobile services and helped reduce prices for consumers.
Source: Independent Evaluation Group.
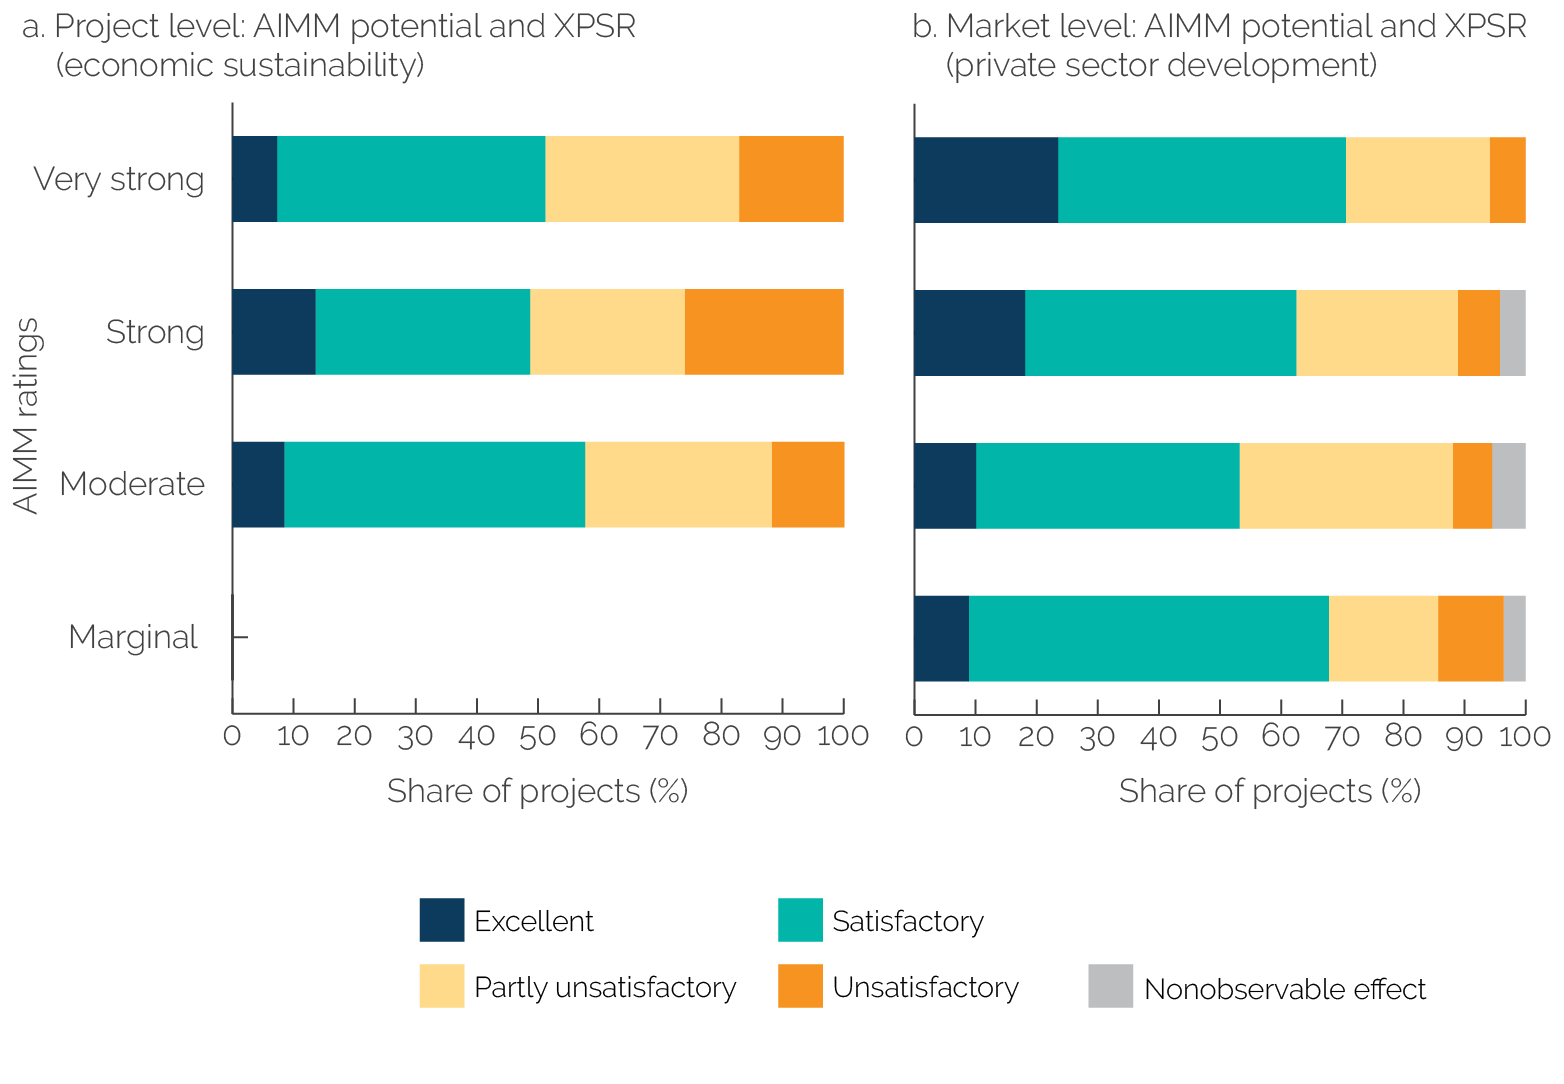
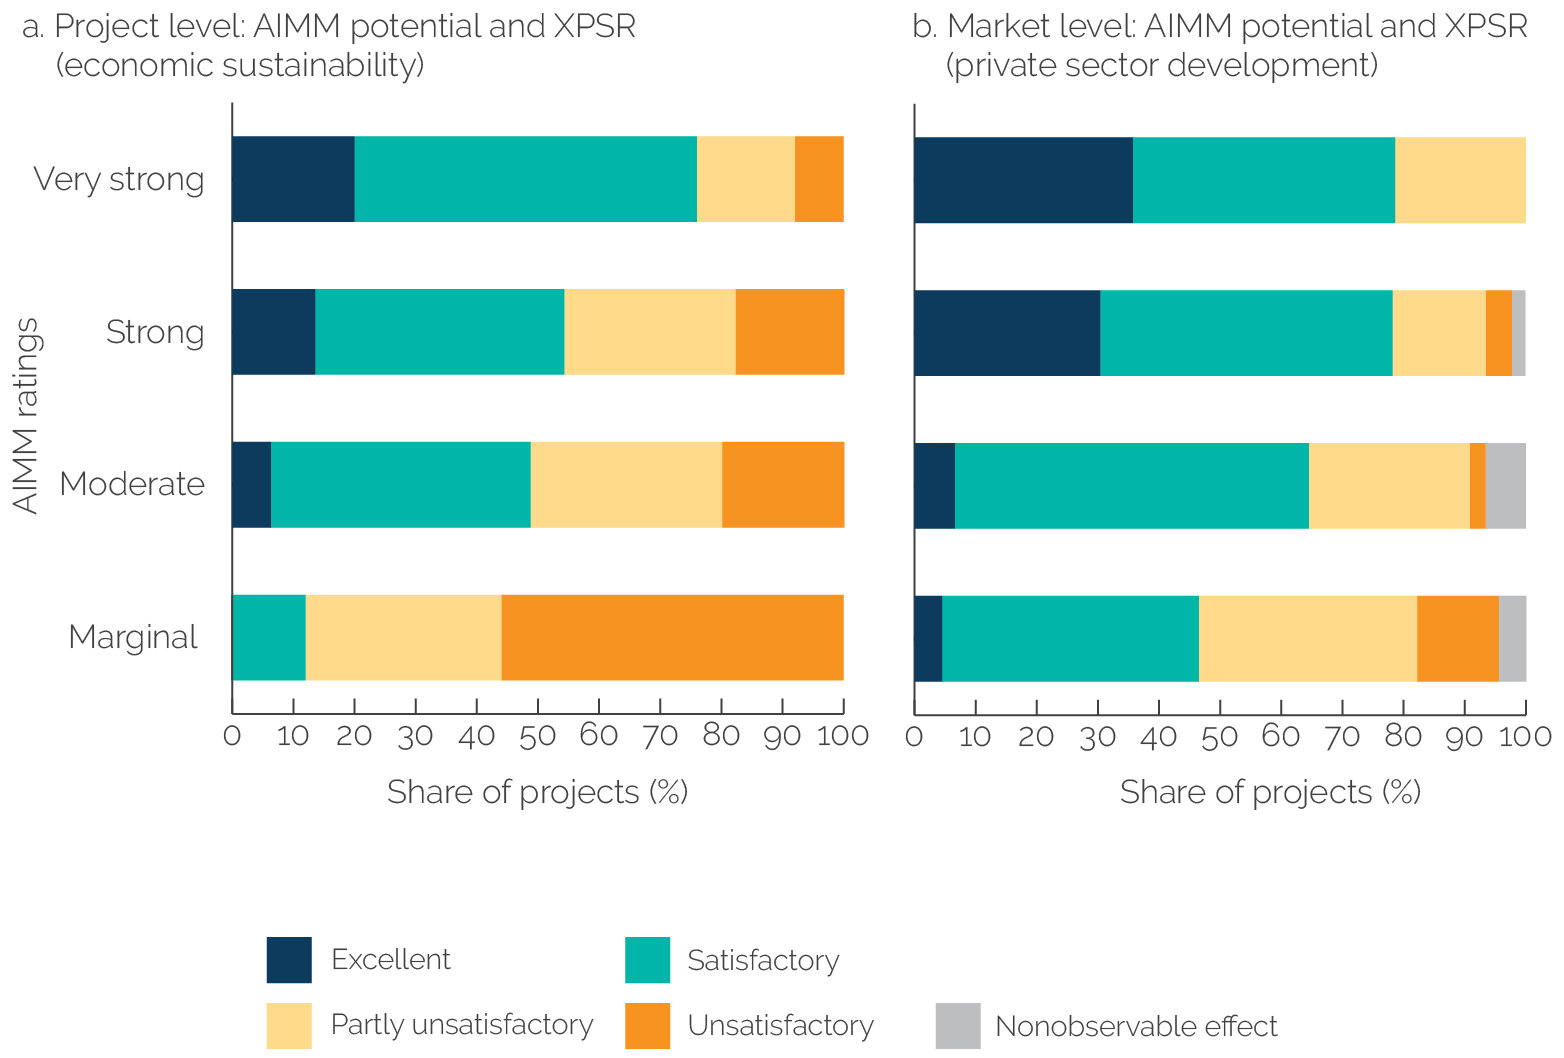
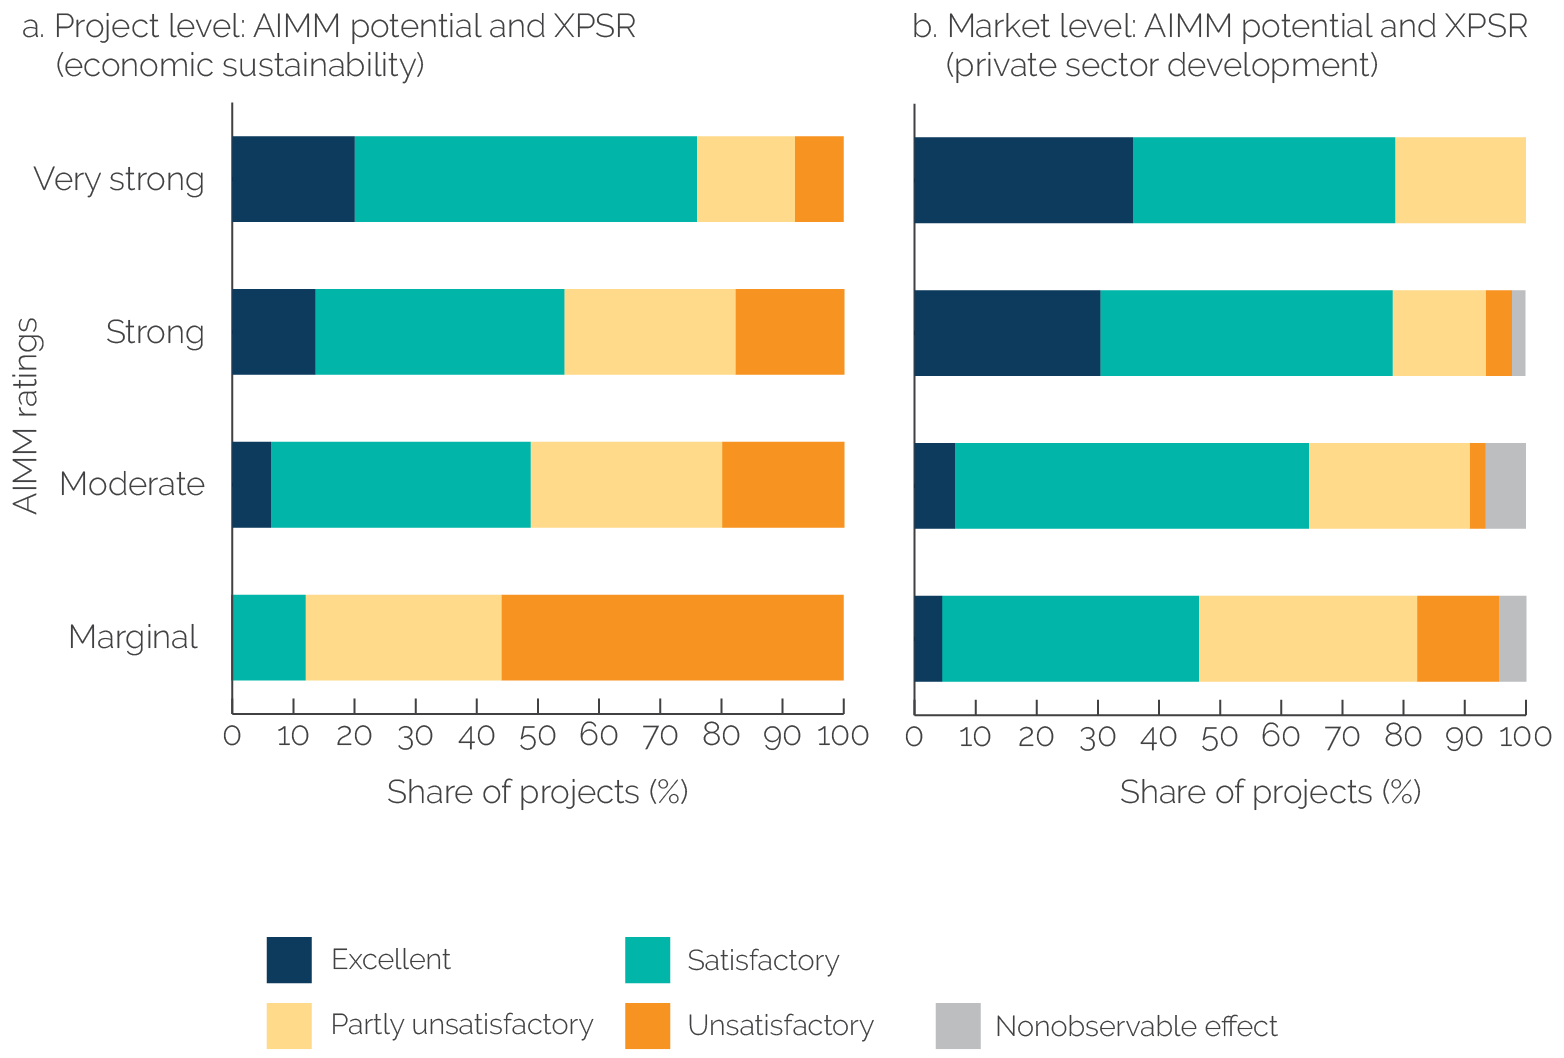
Projects with high development potential did not have lower XPSR ratings. A high development potential means a higher magnitude of development challenges in a given country and a more intense IFC contribution toward these challenges. As figures 3.6 and 3.7 show, projects with high development potential are not accompanied by lower XPSR ratings or more variance, which undermines a common assumption that the more sophisticated or challenging outcomes associated with higher development potential would contribute to lower ratings. However, this finding should be interpreted cautiously, since it is based on an analysis of projects with backfilled AIMM data. The positive correlation between development potential and ratings is an interesting finding, but further analysis is required to determine what drives it. (For a comparison between the AIMM and the XPSR frameworks, see appendix A.)
Figure 3.6. XPSR Ratings by AIMM Development Potential Ratings at Approval

Source: Independent Evaluation Group.
Note: Panels show the percentage of projects with AIMM development potential ratings at approval, from marginal to very strong, with XPSR ratings in economic sustainability (panel a) and private sector development (panel b) from unsatisfactory to excellent. AIMM = Anticipated Impact Measurement and Monitoring; XPSR = Expanded Project Supervision Report.
Figure 3.7. XPSR Ratings by AIMM Development Potential, Ratings at Monitoring
Source: Independent Evaluation Group.
Note: Figures show the percentage of projects with AIMM development potential ratings at monitoring, from marginal to very strong, with XPSR ratings in economic sustainability (panel a) and private sector development (panel b) from unsatisfactory to excellent. AIMM = Anticipated Impact Measurement and Monitoring; XPSR = Expanded Project Supervision Report.
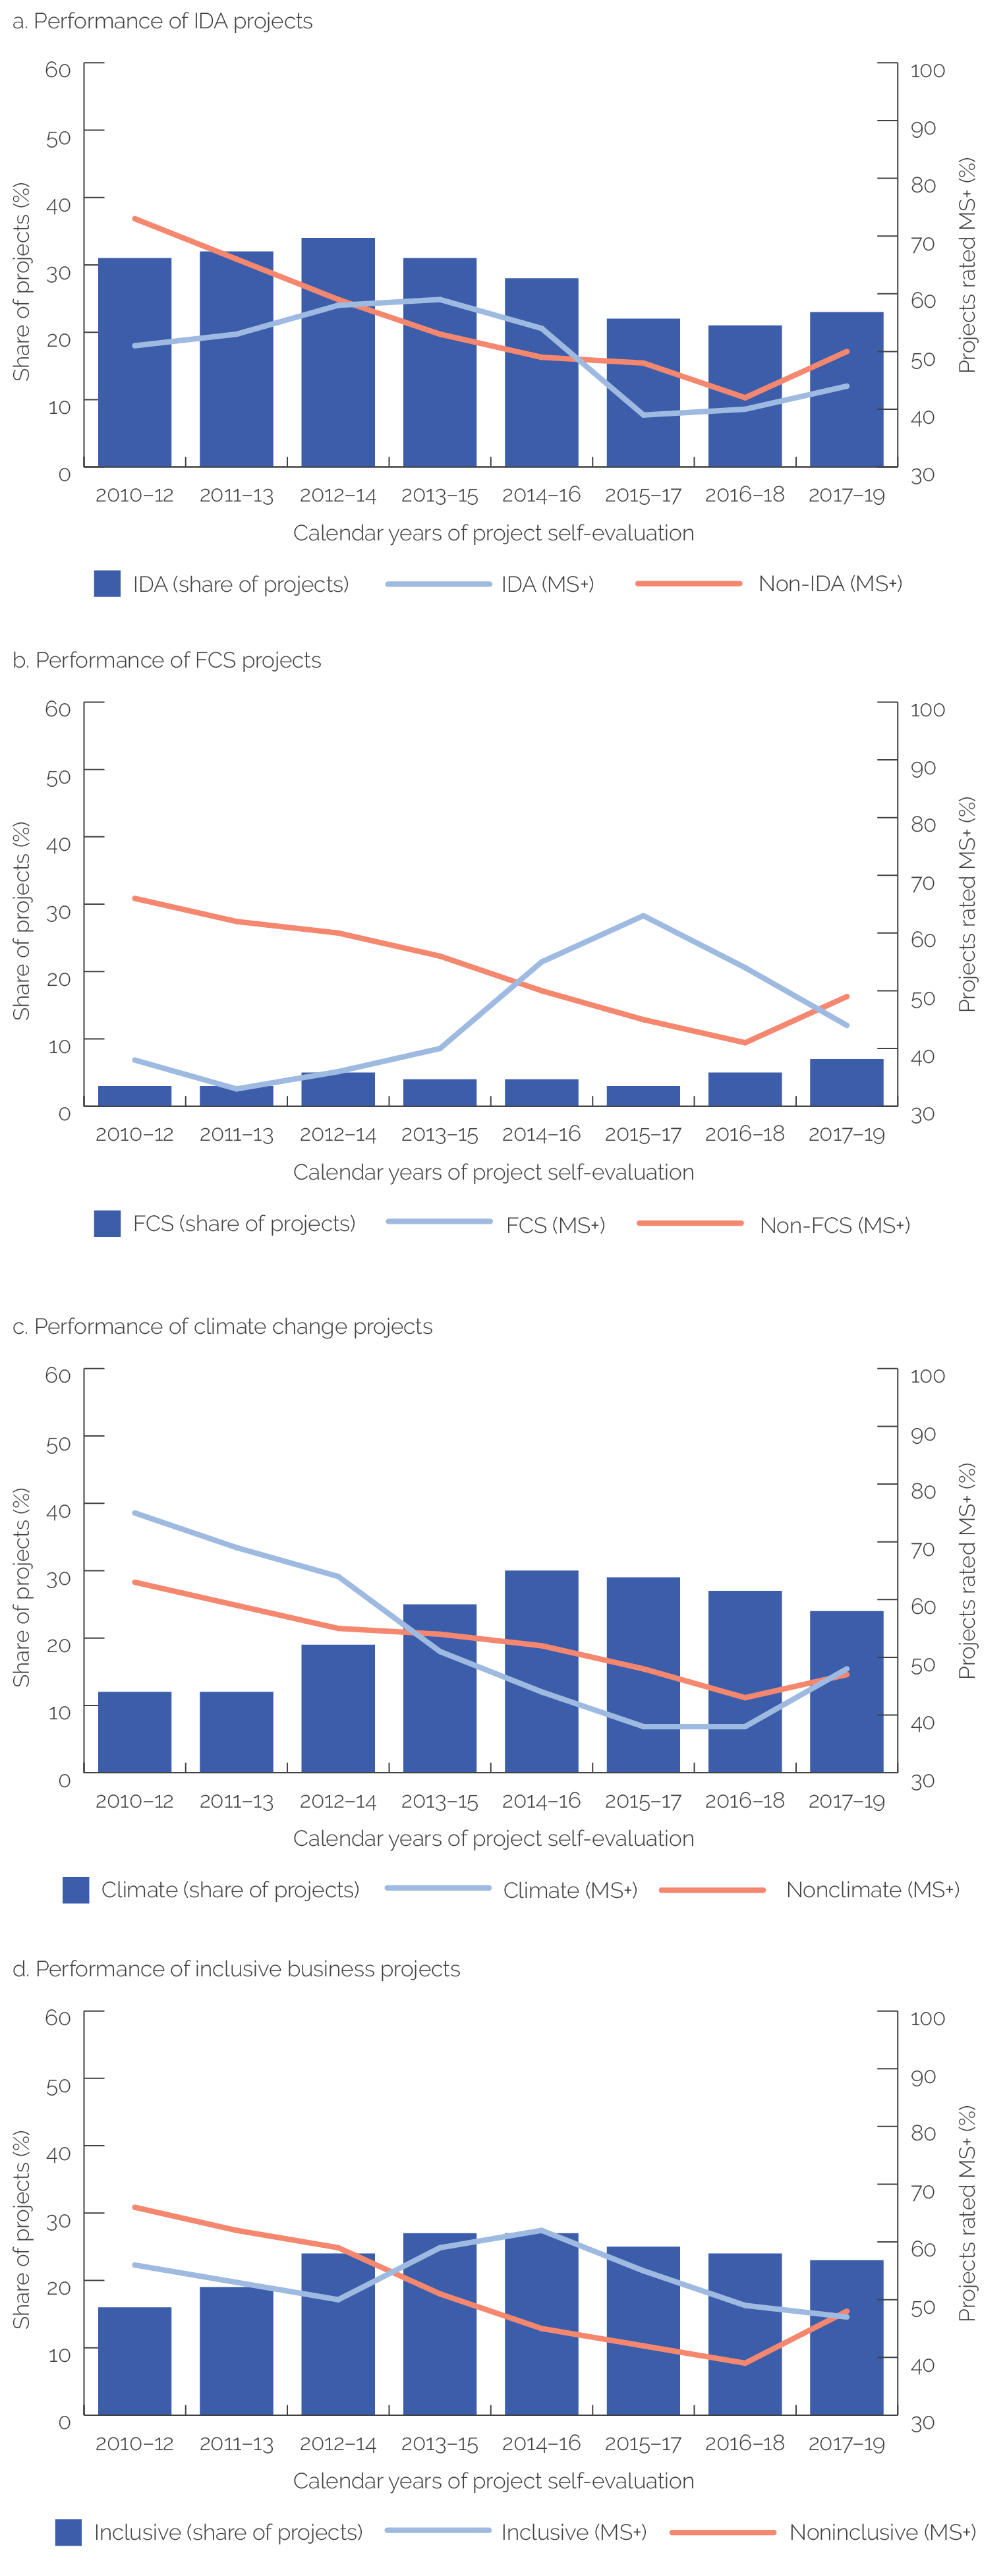
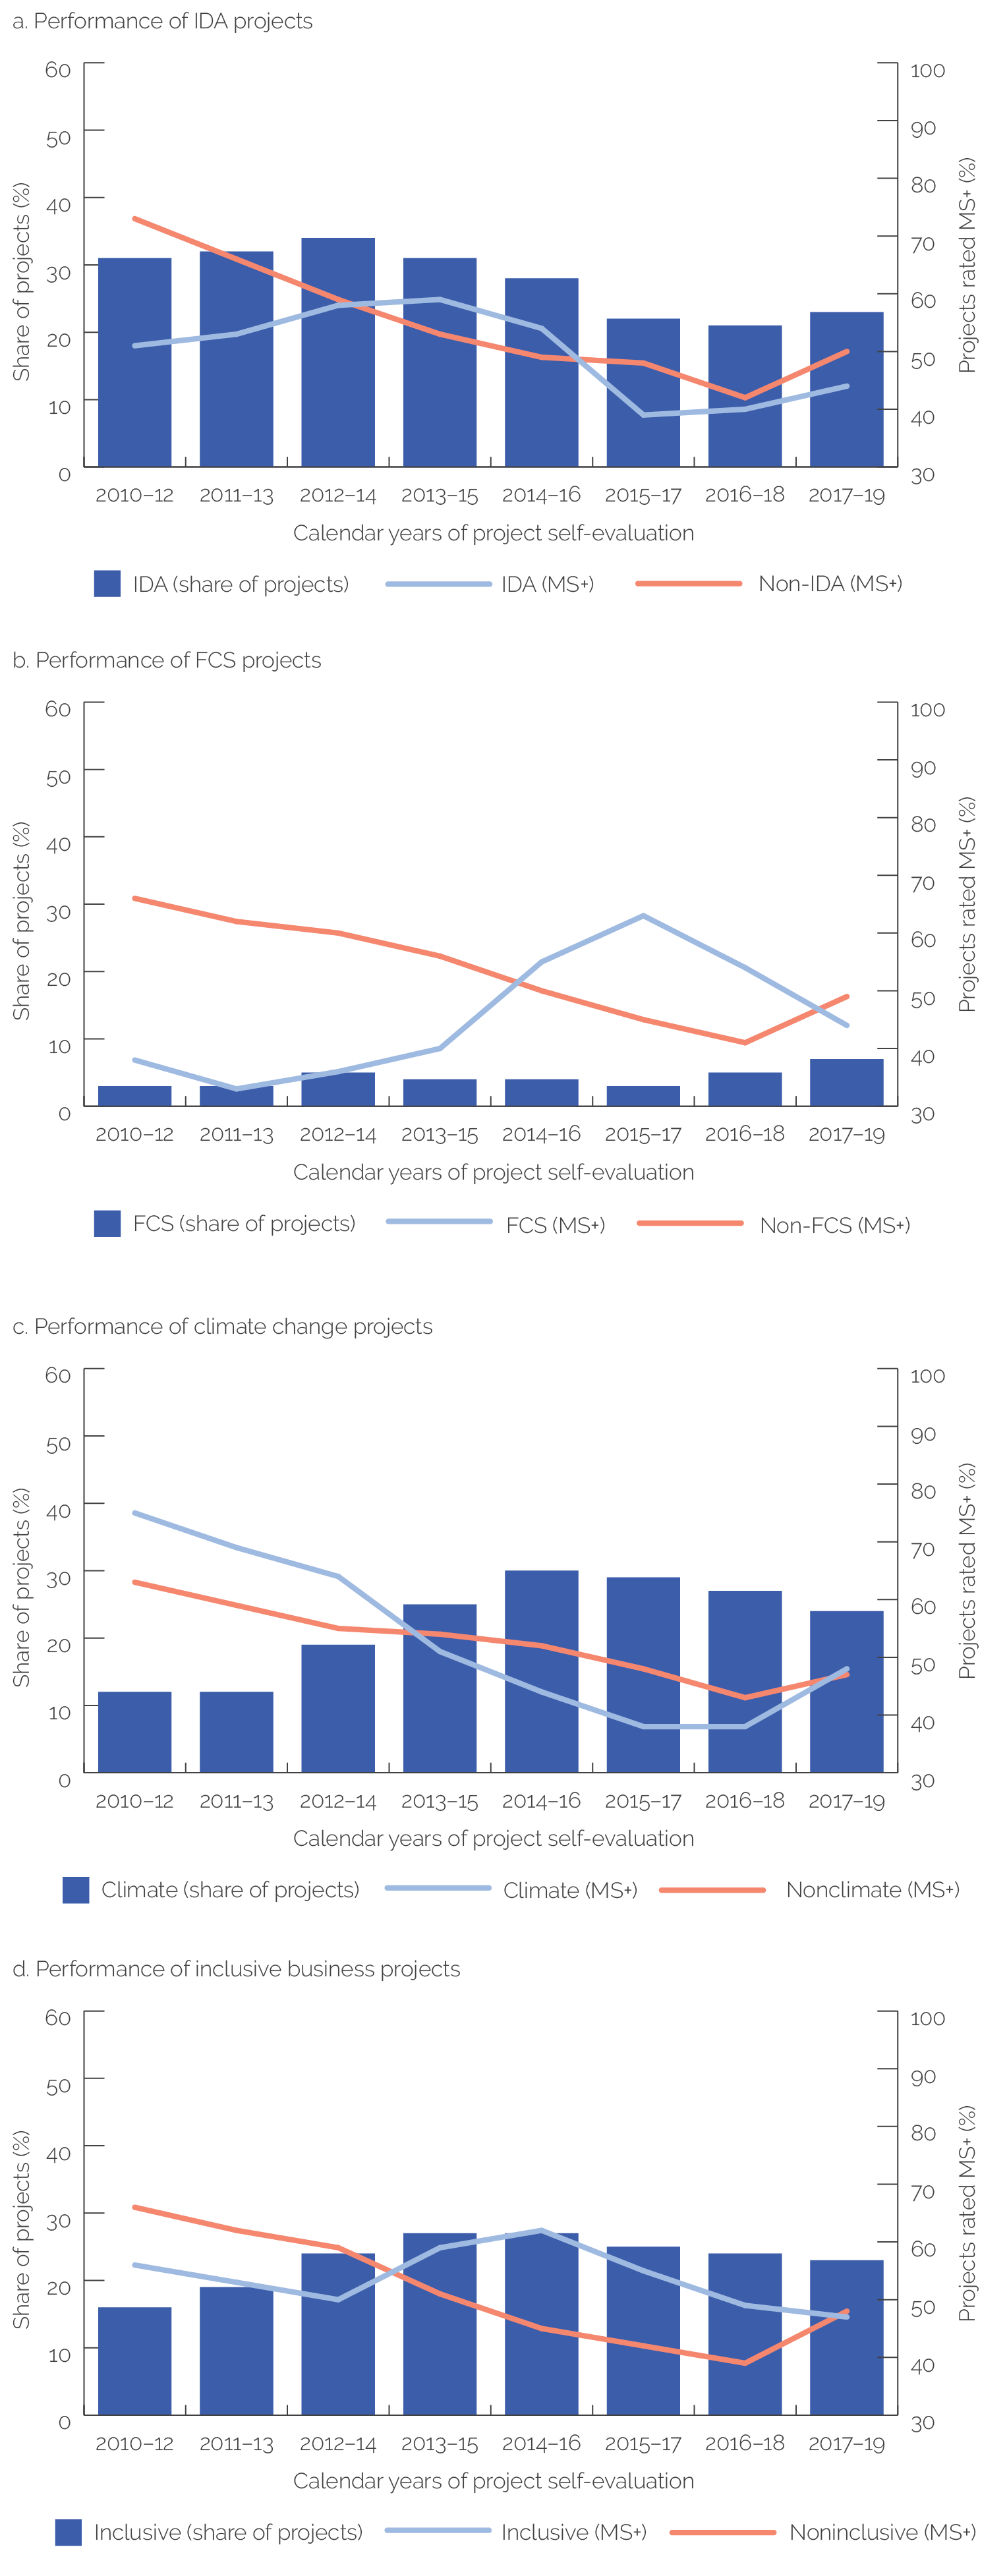
IFC projects that were aligned with prominent corporate priorities did not have consistently lower ratings than projects that did not. We looked at projects that addressed IFC’s corporate priorities of climate change, IDA countries, FCS, and inclusive business, which includes gender priorities. Box 3.4 describes each of these priorities in more detail. Figure 3.8 shows the success rate (defined as having an overall XPSR development outcome rating of MS+) of projects with or without different corporate priorities. Since 2010–12, the performance of the two categories of projects has varied, with no obviously consistent pattern. In the most recent years, inclusive business projects had better results than projects that did not integrate inclusive business, whereas IDA projects, FCS projects, and climate change projects were less successful over a longer period, possibly contributing to IFC’s longer-term ratings declines. That said, the performance of IDA projects and climate change projects has improved recently. The latter is noteworthy because of the various legal, technological, and market-related challenges that climate change projects face. As IFC projects increasingly embrace corporate priorities for the public good, it is critical to monitor their impact on project outcomes to ensure that proper mitigation measures are in place and that there are proper incentives for private enterprises to pursue these higher-level goals.
Figure 3.8. IFC Projects with Development Outcome Rated MS+, with and without Corporate Priority Objectives
Source: Independent Evaluation Group.
Note: FCS = fragile and conflict-affected situation; IDA = International Development Association; IFC = International Finance Corporation; MS+ = mostly successful or above.
Box 3.4. IFC’s Corporate Priorities
International Development Association (IDA) countries. IDA countries have been a priority area for the International Finance Corporate (IFC). Most recently, as part of the 2018 capital increase package, IFC committed to delivering 40 percent of its overall business program to IDA and fragile and conflict-affected situation (FCS) countries, including 15–20 percent to low-income IDA and IDA FCS countries.
Fragile and conflict-affected situations. IFC has supported investments in FCS since 2009 and adopted an FCS strategy in 2012.
Climate change. The World Bank Group launched its first Climate Change Action Plan in 2016 and has released a second plan for 2021–25. In the second plan, IFC committed to aligning 100 percent of new operations to the Paris Agreement goals by 2025.
Inclusive business, including gender. In IFC, the inclusive business concept was initiated in 2010, together with the establishment of an inclusive business unit. Since then, IFC has supported inclusive business in a wide range of industries.a
Methodologies. To assess the relationship between projects that intend to address corporate priorities and their Expanded Project Supervision Report ratings, we classified all projects evaluated since the calendar year 2012 cycle based on the flag provided by the IFC team for climate change and inclusive business and IDA and FCS classification at the time of evaluation.b
Source: Independent Evaluation Group.
Note: a. Gender is another of IFC’s corporate priorities. However, the Results and Performance of the World Bank Group report team decided to focus on inclusive business, which also includes gender aspects, rather than gender itself, because the Bank Group’s gender strategy was only launched in 2016, so projects were not flagged for gender elements before that year.b. Subject to the availability of data at the time of assessment. For country classification for IDA and FCS, historical country classification based on the Bank Group’s classification was applied for evaluation year of projects. For example, for a project in the 2016 evaluation year, IDA and FCS country classifications of the Bank Group in 2016 were applied.
Advisory Services
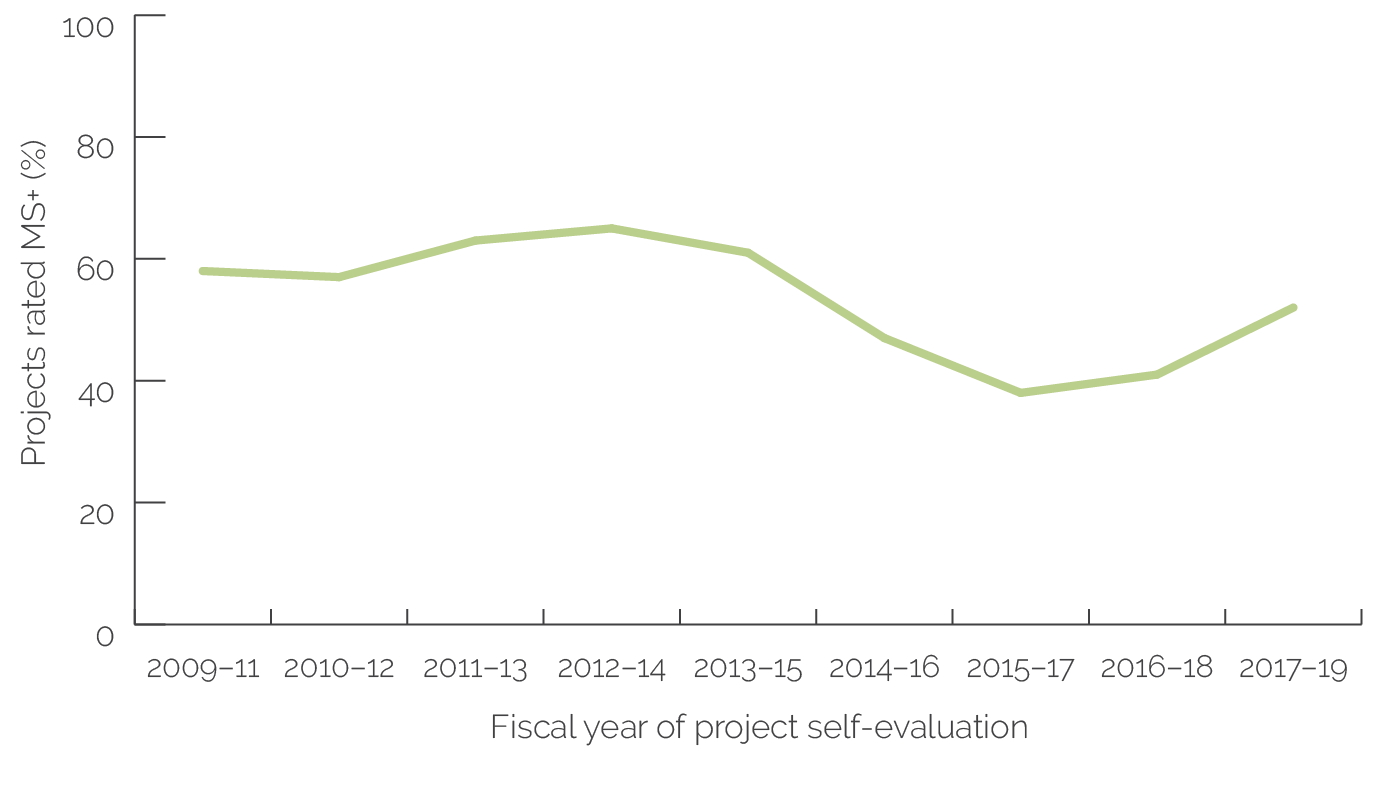
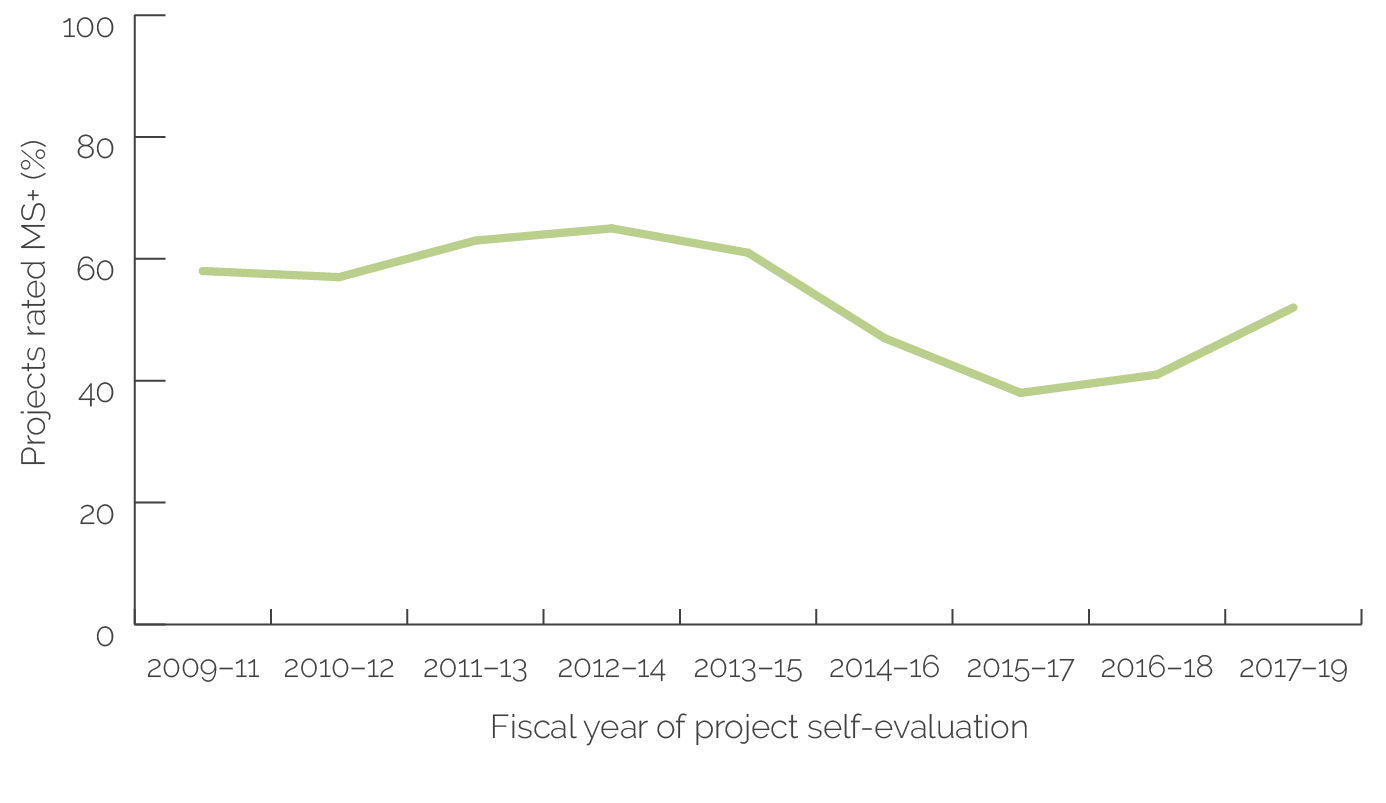
Development effectiveness ratings for IFC’s advisory services projects continue to improve (figure 3.9). Development effectiveness ratings of MS+ fell to their lowest levels in FY15–17 at 38 percent, but they have been improving ever since, reaching 41 percent in FY16–18 and 52 percent in FY17–19. When calculated by advisory projects’ total funding amount rather than the number of projects, development effectiveness ratings declined from 70 percent MS+ in FY12–14 to 33 percent in FY15–17, before increasing to 51 percent in FY17–19.
Figure 3.9. IFC Advisory Projects’ Development Effectiveness Ratings
Source: Independent Evaluation Group.
Note: IFC = International Finance Corporation; MS+ = mostly successful or better.
Several factors influence the development effectiveness ratings for IFC’s advisory projects. As reported in previous RAPs, large project sizes, longer project durations, and team leader changes have a statistically significant negative association with project success. Other factors that influence IFC’s advisory services ratings include the client’s commitment, robust project M&E, and IFC’s flexible and proactive supervision. Moreover, this RAP’s analysis of recent evaluations revealed two additional aspects that have improved ratings, including improvements to IFC’s work quality and the use of improved evidence to monitor development results.
IFC has taken actions to improve advisory services projects, possibly leading to better ratings. These actions were in response to findings from a joint IFC-IEG work quality study for advisory projects from 2017. These actions have improved IFC’s annual work quality ratings since FY18 in both project preparation and design and project implementation and supervision, with the latter improving from 47 percent in FY17 to 74 percent in FY19. The effect of IFC’s improved work quality at project implementation and supervision, particularly management’s enhanced review of project status and the introduction of internal mechanisms to increase management’s accountability at all project stages, has likely contributed to the overall development effectiveness ratings increase.
IFC’s PCRs have shown improved M&E and use of evidence, which likely contributed to improved development effectiveness ratings. IFC’s PCRs are self-evaluation documents for closed IFC projects. The improved ratings were particularly notable for development effectiveness and, most significantly, outcome ratings. For overall development effectiveness and outcomes, the share of PCRs that used quality evidence to a “sufficient extent” and a “great extent” increased from 62 and 46 percent in 2016 to 70 percent for both categories in 2019. The improved evidence base may have also helped reduce the rating variance in PCRs, where the difference between IFC and IEG ratings decreased from 41 percent in 2016 to 13 percent in 2019.
- An Expanded Project Supervision Report is a self-evaluation report prepared by the International Finance Corporation (IFC) project team and is typically prepared five to seven years after the project was approved by the Board. The EvNote (Evaluation Note) is a validation report of the Expanded Project Supervision Report prepared by the Independent Evaluation Group (IEG).
- In recent years, Project Evaluation Summaries account for about 25 percent of the projects selected for evaluation.
- Among the projects approved during the global financial crisis in 2008–10, 83 percent were evaluated in the 2013–15 cohort.
- IEG’s review of the calendar year 2019 project cohort by a machine learning framework shows that sponsor risk, country risk, and market or industry risk are factors associated with projects’ success or underperformance.
- The Manufacturing, Agribusiness, and Services Sector Highlights were originally prepared for 2014–18; additional analysis was carried out for the calendar year 2019 projects for the purpose of this Results and Performance of the World Bank Group report.
- The IFC Business Glossary defines greenfield as a “project where no institution, asset or operation currently exists.”
- This assessment uses two metrics to assess the relationship between IFC’s outcome types and project performance, including (i) the achievement of outcome claims, referred to as outcome claim achieved, at the time of evaluation, and (ii) the change of Anticipated Impact Measurement and Monitoring ratings for outcome claims between the project’s approval and monitoring stages.
- In Anticipated Impact Measurement and Monitoring framework, IFC’s assertions explicitly focus on IFC contribution to market changes, rather than attribution.
- IEG’s thematic evaluation Creating Markets to Leverage the Private Sector for Sustainable Development and Growth (World Bank 2019a) reinforces this view by emphasizing the critical role an enabling environment plays in creating markets and calling for strengthened monitoring and evaluation systems for market creation projects.
- To classify projects with market outcome intentions, the Results and Performance of the World Bank Group report team divided projects into three groups: (i) projects without market outcome claims, (ii) projects with market outcome claims but without indicators, and (iii) projects with market outcome claims with indicators, the last group having greatest intent to achieve market impact.


