Results and Performance of the World Bank Group 2021
Overview
The Results and Performance of the World Bank Group 2021 (RAP 2021) report by the Independent Evaluation Group (IEG) reviews the World Bank Group’s development effectiveness up to fiscal year (FY)20. The Bank Group includes the World Bank (comprising the International Bank for Reconstruction and Development and the International Development Association [IDA]), the International Finance Corporation (IFC), and the Multilateral Investment Guarantee Agency (MIGA).
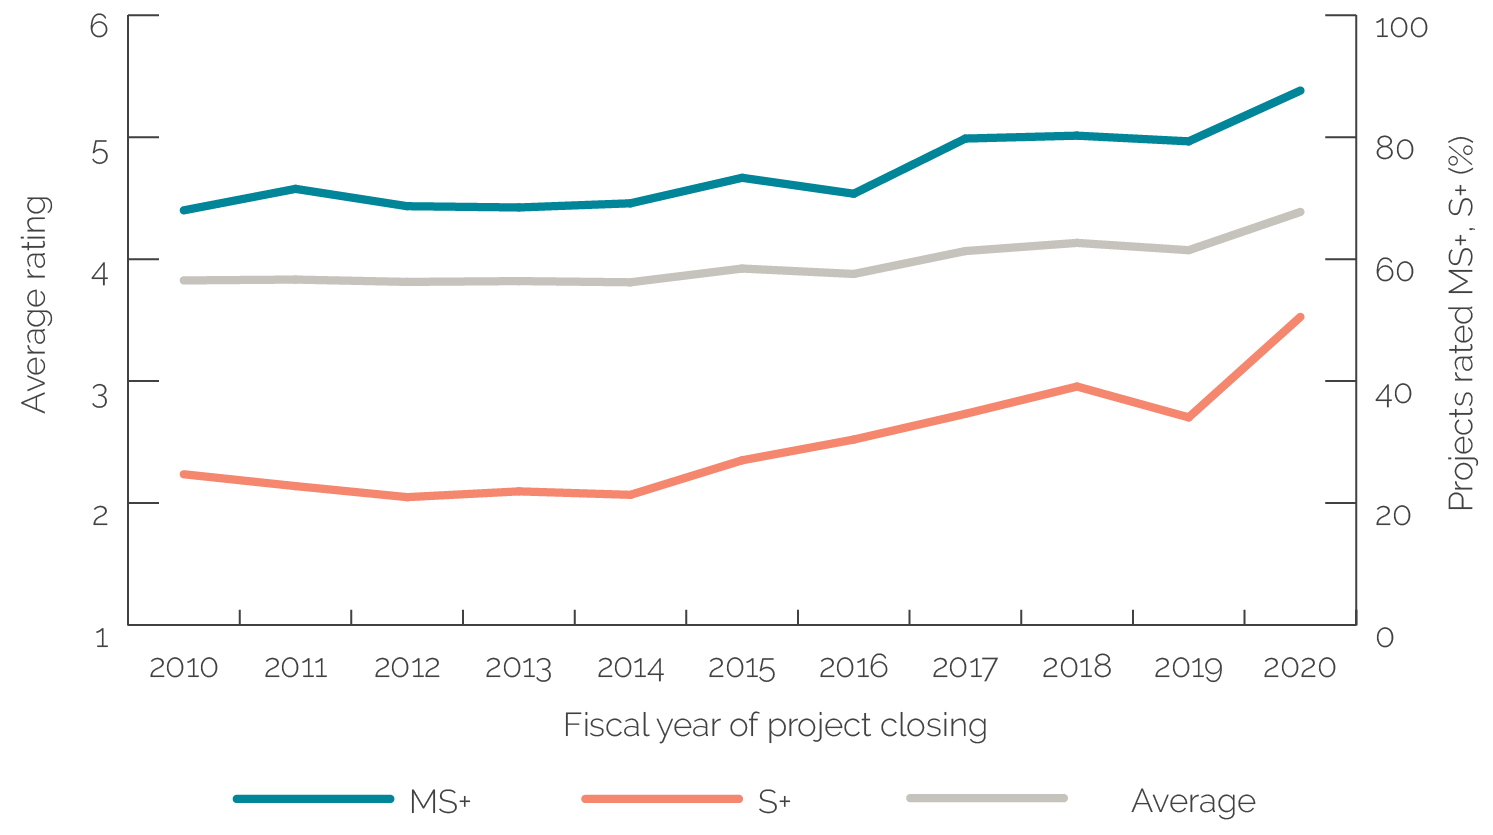
The Bank Group’s project-level ratings improved across the board according to the latest IEG-validated data. For the World Bank, the percentage of projects rated moderately satisfactory or above (MS+) in FY20 rose to 88 percent—a historic high. For IFC, the percentage of investments rated MS+ rose from 42 percent in calendar years (CY)16–18 to 47 percent in CY17–19. For MIGA, 68 percent of projects were rated satisfactory or better in the cohort FY14–19.
The higher ratings for the World Bank were not caused by disruptions to the self-evaluation and validation process from the coronavirus (COVID-19) pandemic. However, it is too early to tell whether COVID-19–related impacts on ratings will show more strongly in the future. That said, we identify several new factors not previously explored in other RAPs or IEG evaluations that can influence ratings. These factors include a project’s novelty (defined as new or expanded elements in successor projects), selection of indicators and targets, outcome types, and outcome potential (box O.1). Overall, we find that Bank Group teams can improve performance by being innovative in project design and using strong measurement practices to track results.
Box O.1. Methodology
The Results and Performance of the World Bank Group 2021 uses a novel methodology to expand on previous results and performance reports. First, we carry out an in-depth analysis of recent trends for both the World Bank and the International Finance Corporation (IFC). For the World Bank, we analyze a recent jump in project outcome ratings from fiscal years 2019 to 2020. For IFC, we analyze the uptick in ratings of investment projects during calendar year 2019 after several years of declining ratings and a reversal of the trend in calendar year 2018. Second, for the World Bank, we use matched data, linking successor projects in the Education and Transport Global Practices to their predecessor projects (in the same country and sector), to analyze the extent to which the World Bank either repeats project designs or introduces novelty to successor projects. We do this to detect signs of risk-averse or risk-taking behavior. Third, we analyze, in detail, the World Bank’s selection of indicators and use of targets to understand how measurement practices affect ratings and performance. Fourth, for the World Bank, IFC, and Multilateral Investment Guarantee Agency, we look at the relationship between a project’s outcome types and its results. For IFC, we also examine the relationship between a project’s outcome potential and its ratings.
Source: Independent Evaluation Group.
World Bank
The World Bank’s project outcome ratings increased substantially in FY20 (figure O.1). This increase, which occurred for all categories of projects, extends the World Bank’s positive ratings trend from the past several years and is the steepest of the past five years. Ratings increased for projects in all Practice Groups, and the increase was especially steep for Sustainable Development projects and for projects in West Africa and Europe and Central Asia. Ratings also improved in the most challenging places to operate, rising for projects in fragile and conflict-affected situations (FCS) and increasing in IDA countries. Ratings also increased notably for the World Bank’s largest projects—those valued at over $100 million.
Figure O.1. World Bank Project Outcome Ratings, by Number of Projects
Source: Independent Evaluation Group.
Note: MS+ = moderately satisfactory or above; S+ = satisfactory or above.
Disruptions linked to COVID-19 did not appear to contribute to the jump in FY20 ratings or to bias ratings reporting. Higher ratings have been observed throughout the year, before and after the onset of COVID-19. A number of checks on the data confirmed that there was no apparent change in either the speed at which Implementation Completion and Results Reports and Implementation Completion and Results Report Reviews were processed or in the disconnect between their ratings. A check on the shares and ratings of investment policy financing and development policy financing did not find any evidence that the latest ratings increase was driven by changes in lending instruments.
Bank performance ratings, which include quality at entry ratings and quality of supervision ratings, also increased. For quality at entry, the ratings increase between FY19 and FY20 was substantial. Overall, many project categories that experienced large increases in project outcome ratings also experienced increases in Bank performance ratings: This was the case for projects in Sustainable Development, Europe and Central Asia, and IDA non-FCS countries and for large projects (those valued at over $100 million). For other project categories, such as projects in Western and Central Africa, project outcome ratings increased despite decreasing Bank performance. It is likely that higher Bank performance (and monitoring and evaluation [M&E] quality—see following paragraph) has had a positive impact on the achievement of project outcomes; however, since all of these ratings are assigned at the same time (when the project outcome is already known), we cannot determine causality.
M&E quality ratings also increased, improving substantially between FY19 and FY20. A deeper analysis of M&E ratings shows that the robust increase in M&E quality had the strongest positive correlation with the recent increase in project-level efficacy ratings. Although correlation does not imply causation, these increases, in line with past RAPs and several studies, are indicative of improvements in the World Bank’s ability to deliver better projects.
Notwithstanding general improvements in M&E quality, a closer look shows that higher project outcome ratings are not necessarily matched by higher quality indicators or more ambitious targets. The implication is that project teams and operational management are not systematically scrutinizing the selection of project targets and indicators, leaving an arbitrary space for deciding whether projects achieved their intended results or not. For instance, analysis shows that not all projects with institutional strengthening objectives have indicators to measure them. Many rely on weak, indirect, or anecdotal evidence with an overreliance on measured outputs over outcomes. Efficacy ratings for these projects were no worse, however, than the one-third of projects that did opt for a more direct and robust measurement approach. Although this is preliminary analysis, it could imply that final ratings are an imperfect indicator of whether or not intended outcomes are achieved and that there remain limited incentives in the system to adopt a more robust measurement approach.
There is a weak relationship between project efficacy ratings and the type of outcomes (that is, the type of intended change) a project aims to achieve. Our analysis indicates that only 4 outcome types out of 16 identified (expanded access to services, increased human capital, improved enterprise and sector performance, and enhanced equity and inclusion) have higher efficacy ratings than the others, but this is because they have higher M&E quality, which is what mostly drives the higher efficacy ratings.
One of the questions underlying the longer-term upward trend in ratings is whether it is a result of fewer risks being taken. This can express itself in a tendency to repeat project designs rather than embracing innovation. We looked at this in two Global Practices—Transport and Education—and found that successor projects that introduced novelty—introducing new or expanded elements over the previous project—performed as well as or better than projects that closely replicated the predecessor project. The results suggest that the World Bank has been able to take informed risks and introduce new elements relevant to each context without suffering lower project outcome ratings.
International Finance Corporation
Investment Projects
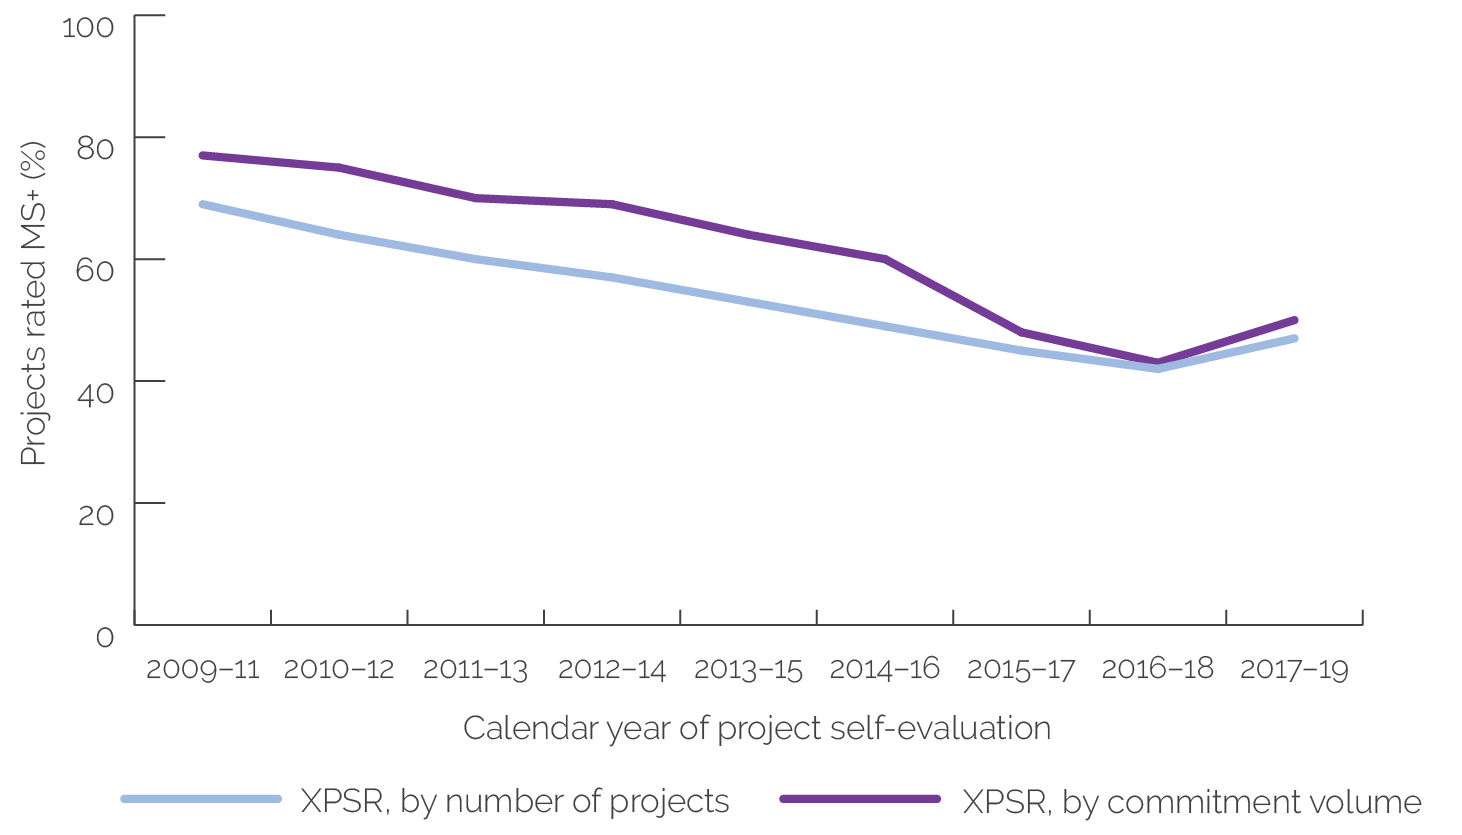
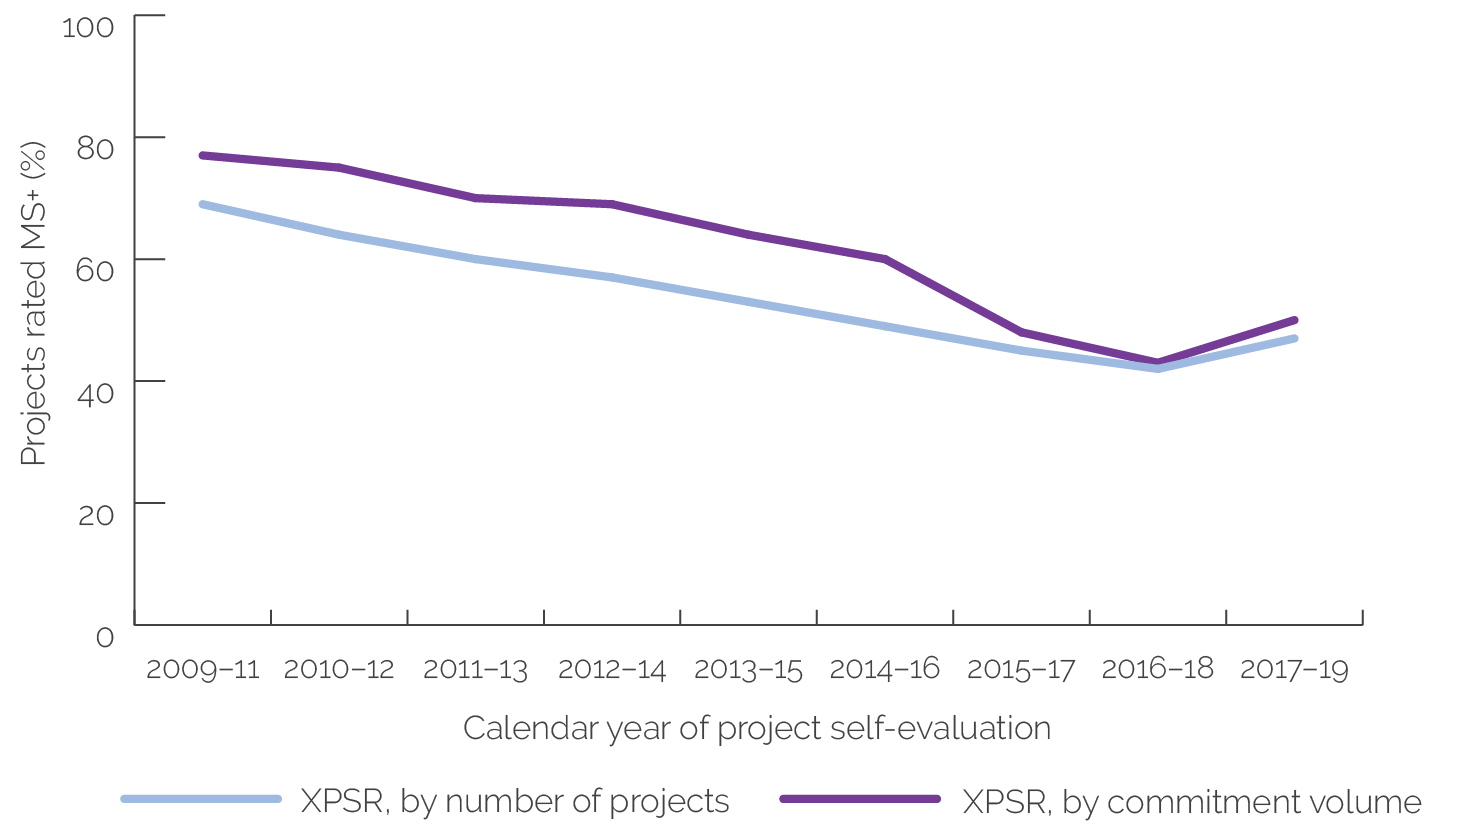
IFC’s development outcome ratings for investment projects improved recently after several years of decline that continued until CY16–18 (figure O.2), when 42 percent of projects were rated mostly successful or better. When measured annually, the overall development outcome success rate was lowest in CY17, at 41 percent. However, in CY17–19, IFC’s investment project ratings reversed this declining trend, improving to 47 percent mostly successful or better. The annual overall development outcome success rate improved by 18 percentage points to 60 percent in CY19. Three of IFC’s four industry groups show a similar trend of improved ratings. This is good news, although it is too soon to conclude that the declining trend was completely reversed.
IFC’s recent efforts to address negative influences on ratings may have paid off in the ratings improvements. Previous RAPs identified internal work quality issues, external risks, and broader market trends as factors that drive IFC’s investment project ratings. In the past few years, IFC has created a new vice presidential unit to strengthen its project and macroeconomic analyses, launched the Anticipated Impact Measurement and Monitoring (AIMM) framework, and strengthened the Accountability and Decision-Making framework. IFC’s management also improved the quality of self-evaluations. Although difficult to pinpoint precisely, it is likely that some of these efforts may be reflected in the recent ratings uptick. For example, after management’s push to improve Expanded Project Supervision Reports (XPSRs), the share of XPSRs nominated as best practices increased from 12 percent in 2016, 11 percent in 2017, and 10 percent in 2018 to 20 percent in 2019. These efforts also increased the dialogue between IFC and IEG on project self-evaluations and reduced IEG-IFC ratings variance from 31 percent in CY17 to 8 percent in CY19.
Figure O.2. IFC Investment Project Development Outcome Ratings
Source: Independent Evaluation Group.
Note: IFC = International Finance Corporation; MS+ = mostly successful or better; XPSR = Expanded Project Supervision Report.
In CY19, IFC’s subsector composition had fewer poorly performing clients and fewer greenfield projects (for the Financial Institutions Group), which also had a positive impact on ratings. In the Infrastructure industry group, there were fewer platform companies in the power sector, junior miners in the mining sector, and nonmobile telecom clients in the telecom, media, and technology sectors. These types of clients tend to have lower ratings than other clients. In Manufacturing, Agribusiness, and Services, the combination of fewer retail, tourism, construction, and real estate projects (whose performance declined in CY19) with more agribusiness and manufacturing projects (whose performance improved in CY19) contributed to IFC’s aggregated improved ratings. For the Financial Institutions Group, the lower share of greenfield projects, which are projects that finance new ventures and activities and tend to have lower development outcome ratings, contributed to positive results in CY19 compared with previous years. Another factor behind the Financial Institutions Group’s recently improved development outcome ratings is the improving ratings of projects in Europe and Central Asia, despite the Region’s unstable economic environments.
IFC projects are less likely to achieve market-level claims than project-level claims. Project-level claims, or project-level outcomes, are defined as a project’s direct and indirect effect on stakeholders, the economy, and the environment. Market-level claims are derived effects, defined as a project’s ability to catalyze systemic changes beyond those brought about by the project itself. Market-level outcome types also have a larger share of downgraded AIMM claim ratings than project-level outcome types. These results show that it is more difficult for IFC to achieve and measure market-level outcomes than project-level outcomes. Market-level outcomes depend on the broader market environment and external factors and are hard to attribute to IFC because individual projects generally have a minimal impact on the broader market. Market-level outcomes are also difficult to measure because they materialize over the long term and few indicators can measure a project’s contributions with certainty. By contrast, project-level outcomes have shorter time horizons and often provide goods, services, financing, or infrastructure, all of which IFC and its counterparts have more control over achieving.
Projects with high development potential were not accompanied by lower XPSR ratings. A high development potential means a higher magnitude of development challenges in a given country and a more intense IFC contribution toward these challenges, as defined in IFC’s AIMM framework. The fact that higher development potential did not lead to lower ratings undermines a common assumption that a higher development potential would contribute to lower ratings for IFC because of more sophisticated or challenging outcomes. Instead, the results show the opposite outcome: Projects with high development potential are not accompanied by lower XPSR ratings or higher variance in ratings. The results also show that IFC projects that addressed prominent corporate priorities—including climate change, IDA, FCS, and inclusive business (which includes gender)—do not have consistently lower ratings.
Advisory Services
Development effectiveness ratings for IFC’s advisory services projects continue to improve for several reasons. Development effectiveness ratings of mostly successful or better fell to their lowest level in FY15–17 but have been improving ever since (figure O.3). Previous RAPs show that several factors influence these ratings, including large project sizes, longer project durations, team leader changes, the client’s commitment, IFC’s work quality, and IFC’s flexible and proactive supervision. IFC has taken actions to address these factors, possibly leading to better ratings. These actions have improved IFC’s annual work quality ratings since FY18, particularly at project implementation and supervision. Moreover, IFC’s Project Completion Reports have shown improved M&E and use of evidence, which likely contributed to improved development effectiveness ratings. For overall development effectiveness and outcomes, the share of Project Completion Reports that used quality evidence to a “sufficient extent” and “great extent” increased from 62 and 46 percent in 2016 to 70 percent for both categories in 2019. The improved evidence base may also have contributed to reducing the “variance gap” in Project Completion Reports, where the difference between IFC and IEG ratings decreased from 41 percent in 2016 to 13 percent in 2019.
Figure O.3. IFC Advisory Projects’ Development Effectiveness Ratings, by Number of Projects

Source: Independent Evaluation Group.
Note: IFC = International Finance Corporation; MS+ = moderately satisfactory or above.
Multilateral Investment Guarantee Agency
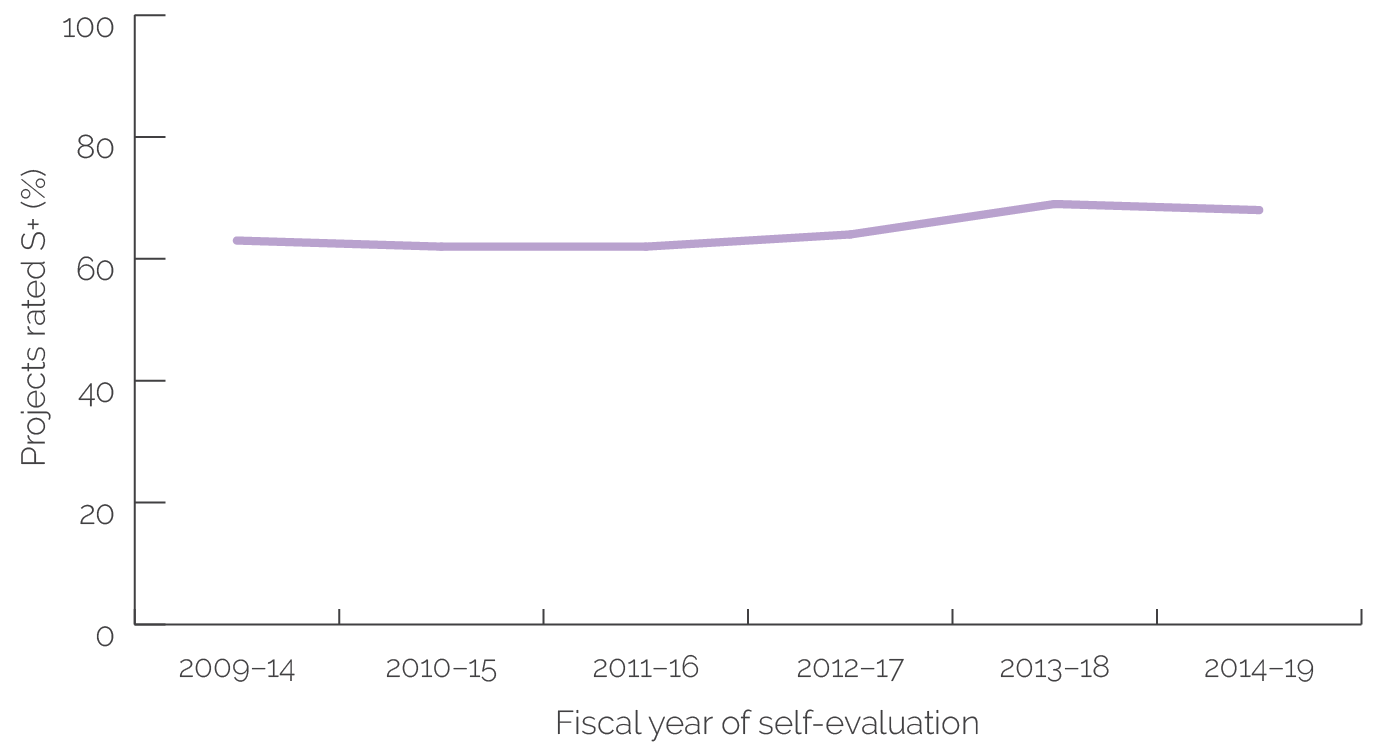
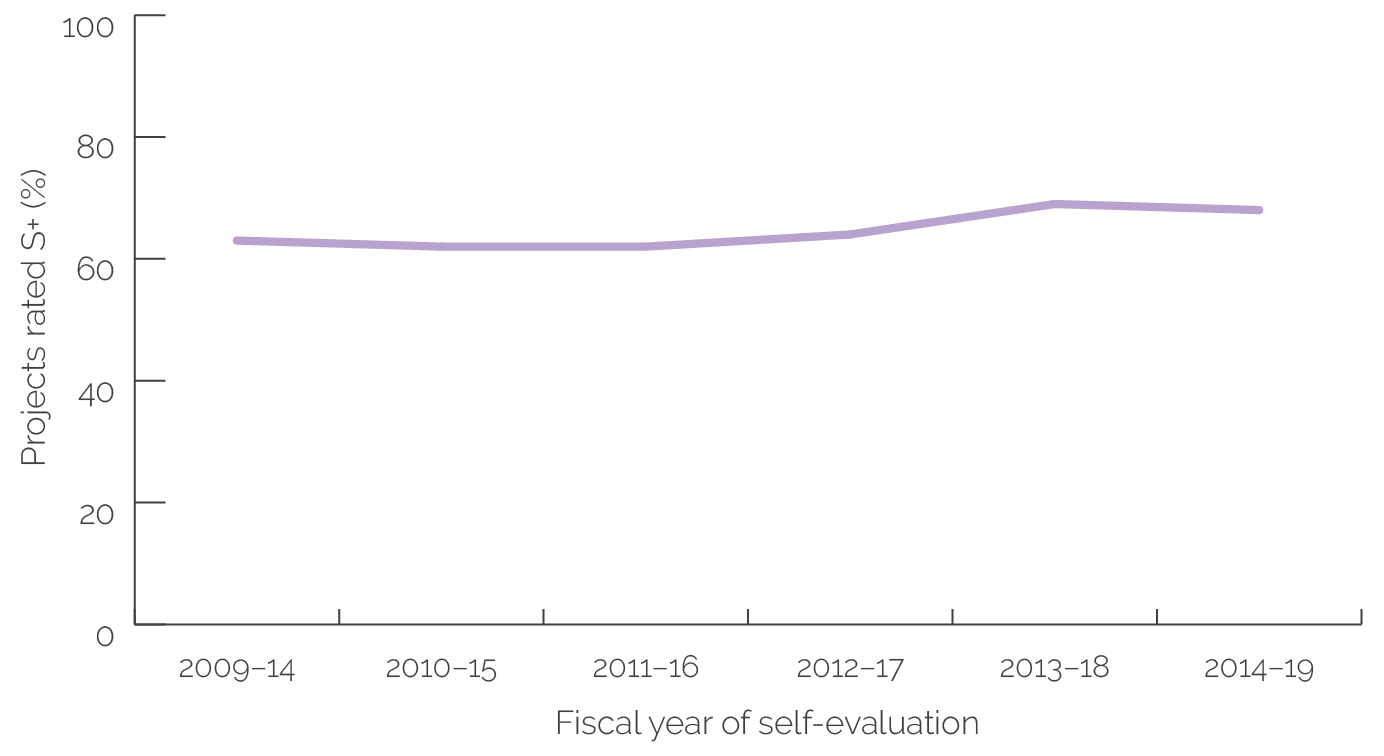
MIGA’s project development outcome ratings have been increasing over the past 10 years. More specifically, MIGA’s development outcome ratings increased from 62 percent satisfactory or above (S+) in FY11–16 to 68 percent S+ in FY14–19 (figure O.4). MIGA’s financial sector had the lowest performance over this period, but its performance also improved. Among MIGA’s four sectors, the Energy and Extractive Industries sector had the highest success rate of all the industry groups, although this has declined recently. MIGA’s Agribusiness and General Services sector’s performance was stable, and the Finance and Capital Markets sector’s performance improved in 2018 and 2019.
Figure O.4. MIGA Project Development Outcome Ratings, by Number of Projects
Source: Independent Evaluation Group.
Note: MIGA = Multilateral Investment Guarantee Agency; S+ = satisfactory or above.
MIGA projects achieve project-level outcomes more often than foreign investment–level outcomes, and projects that address corporate priorities have mixed performances. From FY12–14 to FY17–19, project-level outcome achievement rates substantially increased. Meanwhile, foreign investment–level outcomes were less likely to be achieved. This is partially because of MIGA’s inherent limitations, as a guarantee provider, in terms of collecting data on development results, particularly for foreign investment outcomes that rely on external factors for success. However, MIGA has made efforts to improve its self-evaluation. This suggests that MIGA’s improved development outcome ratings are due to both increased evidence collection in recent years and improvement in performance. Meanwhile, projects addressing certain corporate priorities—including IDA, FCS, climate change, and South-South projects—did not experience a specific impact on ratings.
Implications
- The World Bank and IEG could pay more attention to how well indicators measure project objectives. To do so would require a more systematic approach to gauging the appropriateness of indicators and targets early in the project cycle. A successful approach would include tightening the links between indicators and project objectives and defining targets in relation to scrutinized baselines.
- The World Bank could present ratings with more clarity about their strengths and limitations and could complement ratings with better information on the nature of the underlying development outcomes. IEG and the World Bank could periodically synthesize and report on development outcomes. Potentially, the World Bank could devise a system to regularly harvest project outcomes and key activities and match this information with ratings data for more integrated results and performance monitoring.
- IFC and MIGA could use information on outcome types and other characteristics to better assess risks, ratings, and development outcomes of projects. IFC’s AIMM framework and MIGA’s Impact Measurement and Project Assessment Comparison Tool framework already account for a project’s estimated and actual development potential and development outcome risks. IFC and MIGA could take it a step further by assessing the prevalence of different outcome types and other characteristics in projects to help enhance the system.
- The Bank Group could further emphasize operating “on the frontier” as a goal in addition to meet the Corporate Scorecards rating targets. This shift in emphasis would encourage the Bank Group to inquire further about the motivations for risk taking, the evolution of project designs, the pursuit of corporate priority goals, and the best way to leverage internal resources and the client’s engagement, commitment, and capacity to deliver development results. This could help ensure that the Bank Group continues to selectively take risks to improve development outcomes.


