
The Rigor of Case-Based Causal Analysis
Chapter 2 | Analysis
The causal analysis in the current study proceeded in four stages, as figure 2.1 shows. The first stage was a within-case causal analysis conducted for each of the 16 cases selected for review. For the purposes of this analysis, within-case evidence was defined as “evidence from within the temporal, spatial, or topical domain defined as a case” (Bennett and Checkel 2015, 8). The causal theory developed for the study was traced throughout each case, and the causal contributions of the five identified variables of interest at each step of the theorized causal process were systematically categorized as present or absent, based on rich descriptions developed for each case (as discussed earlier) using triangulated evidence from multiple interviews, document review, data review, and a site visit. Assessments of this evidence resulted in 16 independent case narratives about the causal contributions of the Bank Group and other contributory actors and variables, each including rich and deep description. These narratives and their accompanying case matrixes were collated in a database of qualitative data, which formed the basis for subsequent steps in the analysis.
Figure 2.1. Structure of the Causal Analysis

Figure 2.1. Structure of the Causal Analysis

Source: Independent Evaluation Group.
Note: QCA = qualitative comparative analysis.
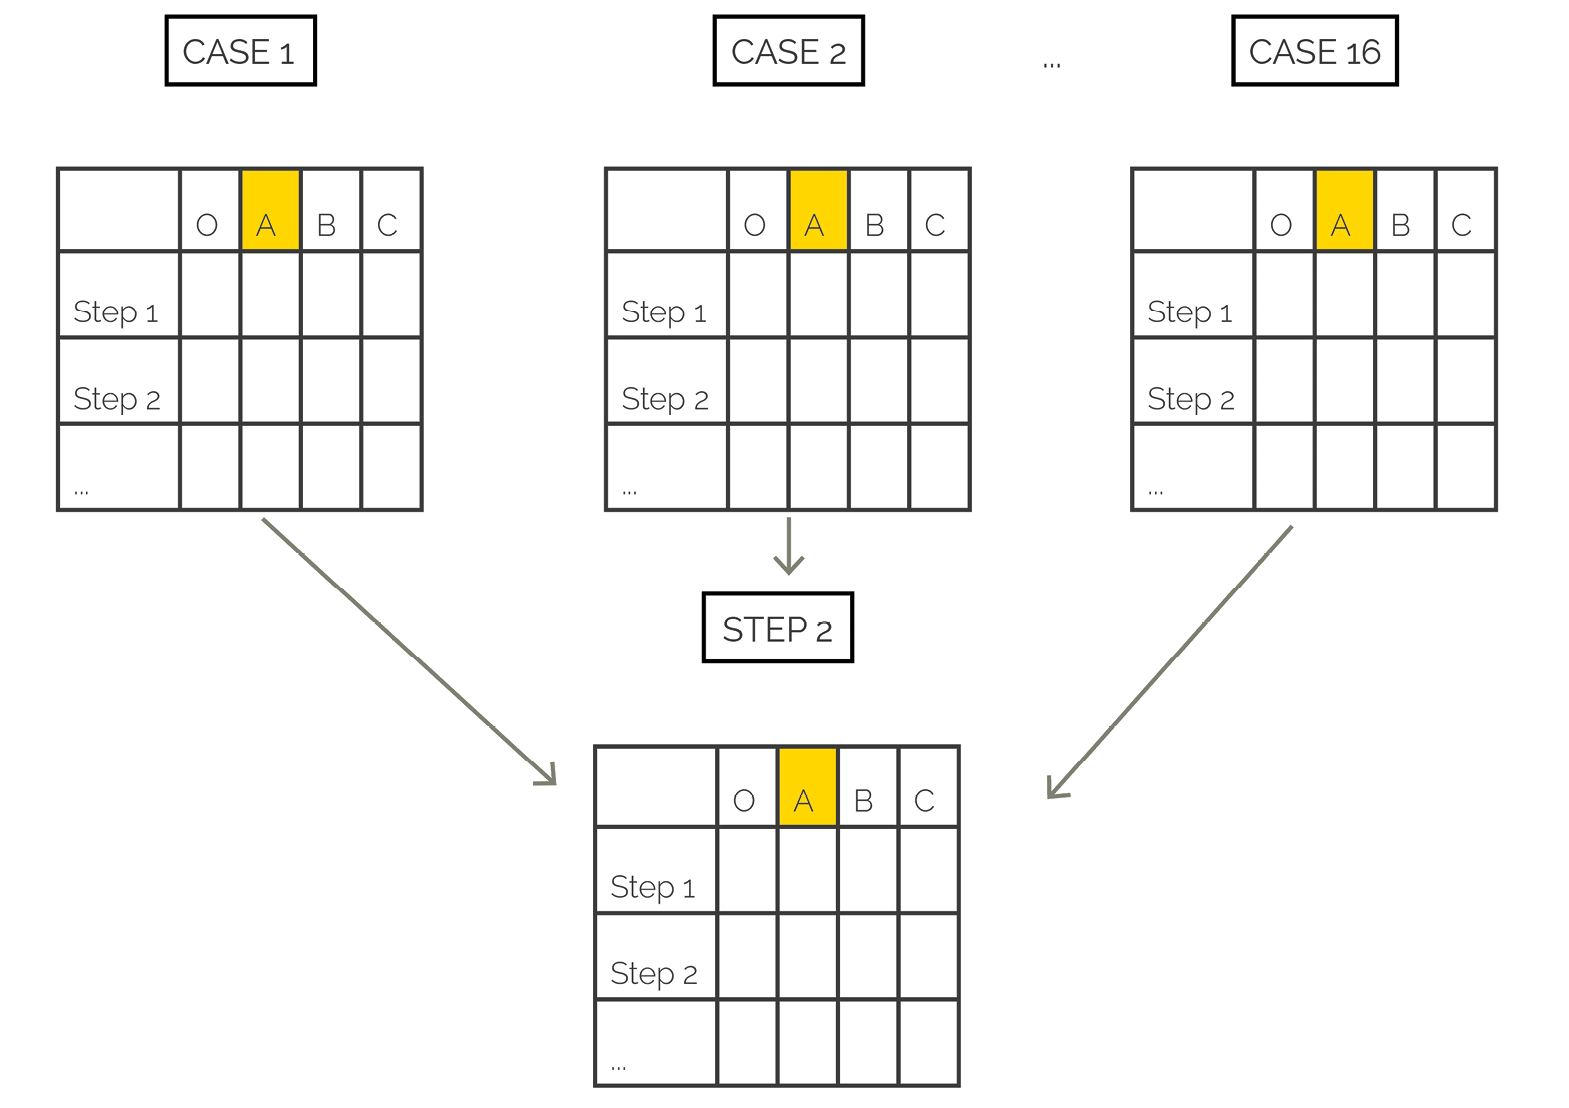
In the second stage, the study team performed a cross-case causal analysis, consisting of a systematic analysis of patterns of convergence and divergence across cases for each step in the theorized causal process. First, the team flipped the case matrixes to create configurational tables (with the cases in the rows and the variables in the columns) for each of the 15 steps of the theorized causal process, as figure 2.2 illustrates.
Figure 2.2. Qualitative Data Processing in Configurational Table
Figure 2.2. Qualitative Data Processing in Configurational Table

Figure 2.2. Qualitative Data Processing in Configurational Table
Figure 2.2. Qualitative Data Processing in Configurational Table
Source: Independent Evaluation Group.
Cases were then grouped by outcome level and by level of Bank Group contribution. These groupings of cases ultimately elicited various patterns of regularity in the contribution of various variables to the outcomes at each step in the theorized causal process. For relevant causal steps, patterns of convergence by technology or by country capacity were also identified.
In the third stage of the analysis, the study team checked the empirical patterns that emerged from the cross-case comparison against the posited causal theory to determine those patterns that fit the theory (matches) and those that did not (mismatches). The causal theory in contributory hypothesis was formalized at this stage. In addition, in identified outlier cases (that is, cases in which explanatory variables other than those included in the causal theory were found that explained the outcomes of interest), the study team systematically checked whether the outliers constituted a refutation of the causal theory or instead illustrated a broken causal process or unmet assumptions. During this stage, the study team put the case evidence in constant dialogue with the theory.
In the fourth and final stage of the analysis, given the causal complexity underlying the explanations of the five main outcomes of interest, the team formally tested the causal theory using crisp-set QCA, a well-established technique that uses Boolean minimization to “simplify complex data structures in a logical and holistic manner”1 (Ragin 2014, viii). Application of the technique requires transforming the main outcome variable and other variables of interest into binary variables (that is, variables that can take the values 0 or 1). For the current study, the study team reformulated all of the variables that captured the contribution of key actors as either high or low and all variables that captured another explanatory variable as either present or absent. At this stage of the analysis, the team had gained adequate substantive knowledge about each case and adequate theoretical knowledge about the most relevant variables included in the analysis to be able to adjudicate consistently across all variables and cases.
In addition, during the transformation of the variables of interest into binary variables, there was also continuous dialogue between the cases and the data set to ensure proper calibration of the variables. For each outcome of interest, the study’s methods expert generated truth tables using the software fsQCA and Venn diagrams using the software Tosmana. (Both the truth tables and the Venn diagrams are illustrated in the next section.) In transforming the variables of interest into binary variables, the study team applied good-practice principles of QCA, notably by ensuring that once the variables were binary, the study included a mix of cases with positive and negative outcomes; that there was sufficient variation for each variable; and that there were no counterintuitive configurations (for example, configurations in which all 1 variables led to a 0 outcome). For three of the theorized causal steps, the Boolean minimizations yielded contradictory configurations (that is, similar configurations that yielded different outcomes); for those steps, the study team sought resolution of the contradictions by examining the coherence of the data included in the cases. The team found that all contradictions could be resolved by reconsidering the ratings or reexamining the way one of the variables was operationalized.
- In Boolean minimization, a long, complex expression is reduced to a more parsimonious expression. As it relates to the type of analysis used in this study, the process can be summarized as follows: “If two Boolean expressions (combining multiple factors) differ in only one causal variable yet produce the same outcome, then the causal variable that distinguishes the two expressions can be considered irrelevant and can be removed to create a simple, combined expression” (Ragin 2014, 83).