
Leveraging Imagery Data in Evaluations
Chapter 1 | Project Background and Challenges
Project Description
The Independent Evaluation Group (IEG) has been exploring the use of different techniques of imagery analysis—including the use of both remote-sensing imagery and digital images—to understand changes in spatial phenomena over time (for example, assessing changes in land use or monitoring deforestation) and to help answer questions on the relevance and effectiveness of development interventions. One example is an IEG assessment of the impact of the World Bank’s Land Development Project (P040975) implemented between 1998 and 2005 in Albania. The project aimed to provide essential infrastructure to underserviced and neglected areas in participating municipalities and to strengthen the institutions responsible for the delivery of urban services at the national and local levels. It focused strongly on infrastructure development, including roads, water supply, drainage, sewerage, electricity, street lighting, and domestic garbage collection. The project was organized in relation to several pilots, one of which (the subject of our study) took place in Bathore.
Bathore, in the administrative unit of Kamëz (municipality of Kamëz, county of Tirana), is located approximately 7 kilometers northwest of Albania’s capital, Tirana, in an area that was previously agricultural land and mostly state owned as part of a cooperative. Difficulties in accessing the housing market in the early 1990s and the movement of large numbers of people from peripheral areas toward the center made several agricultural territories in proximity to Tirana a fertile ground for informal development. This migration and the resulting rapid urbanization led to the formation of informal settlements in Bathore toward the end of 1994 as the area attracted many migrants trying to settle in the vicinity of Tirana. The area started to develop quickly, and state authorities were unable to respond to this quick development with infrastructure. Soon, Bathore became a highly dense but informally developed peri-urban area with a severe lack of infrastructure and services (Shutina 2021). The World Bank’s project aimed to upgrade these informal neighborhoods.
The IEG study attempted to determine the extent of urban growth in the Bathore pilot area and the level of integration of informal settlements into the formal urban fabric. More specifically, the study aimed to address two questions:
- To what extent did land use/land cover change during the project implementation period? “Land use/land cover” describes how land is employed across classes (such as agricultural land, water, woodlands, and built-up environment). The regular monitoring of changes in land use/land cover across time is essential to ensure sustainable urban development and provides valuable inputs to guide development interventions. The study was particularly interested in understanding the shift from agricultural land to built-up areas during this period.
- To what extent were households in upgraded neighborhoods integrated into the formal economy as a result of road improvements? Neighborhood improvements stimulate private investment, integrate informal settlements into the formal urban fabric, and increase neighborhoods’ density in a cohesive manner. Linking neighborhoods to transportation systems provides them with access to local services and jobs. Informal settlements are often cut off from transport networks, preventing households from accessing job opportunities and services. According to the project’s Implementation Completion and Results Report, only 20 percent of households in the project area had members who were employed before the project, reflecting the isolation of informal settlements from the formal economy.
Practical Challenges
Identification of Geographic Boundary
Geospatial analyses usually involve superimposing multiple layers of data, all of which share the same spatial extent (that is, the area of analysis), on one another. Therefore, the first building block in constructing an appropriate data set for the analysis was developing a data layer that could be used to define the precise boundary lines of the study area. This boundary would then define the geographic extent of any subsequent layers of data. Defining an area’s boundary can sometimes be a trivial operation because it often matches political or administrative boundaries (such as those of countries, provinces, or cities). However, in this instance, the area of analysis did not match any preexisting boundary.
The team conducting the analysis resolved this challenge by triangulating multiple sources of data (including printed maps in World Bank reports and available satellite and drone imagery of the area) and consulting multiple times with the project team and local organizations that had been involved in implementing the project. Once the precise project area was identified, we mapped a polygon (shape file) corresponding to this area with an appropriate geographic coordinate reference system using the geographic information system (GIS) software QGIS.
Once we had precisely delineated the study area, the next step was to measure its surface area—important information because it often guides selection of appropriate data sources for analysis (figure 1.1). In this case, we determined that the study area covered approximately 45 hectares.
Figure 1.1. Study Area and Location and Extent of Study Area

Figure 1.1. Study Area and Location and Extent of Study Area
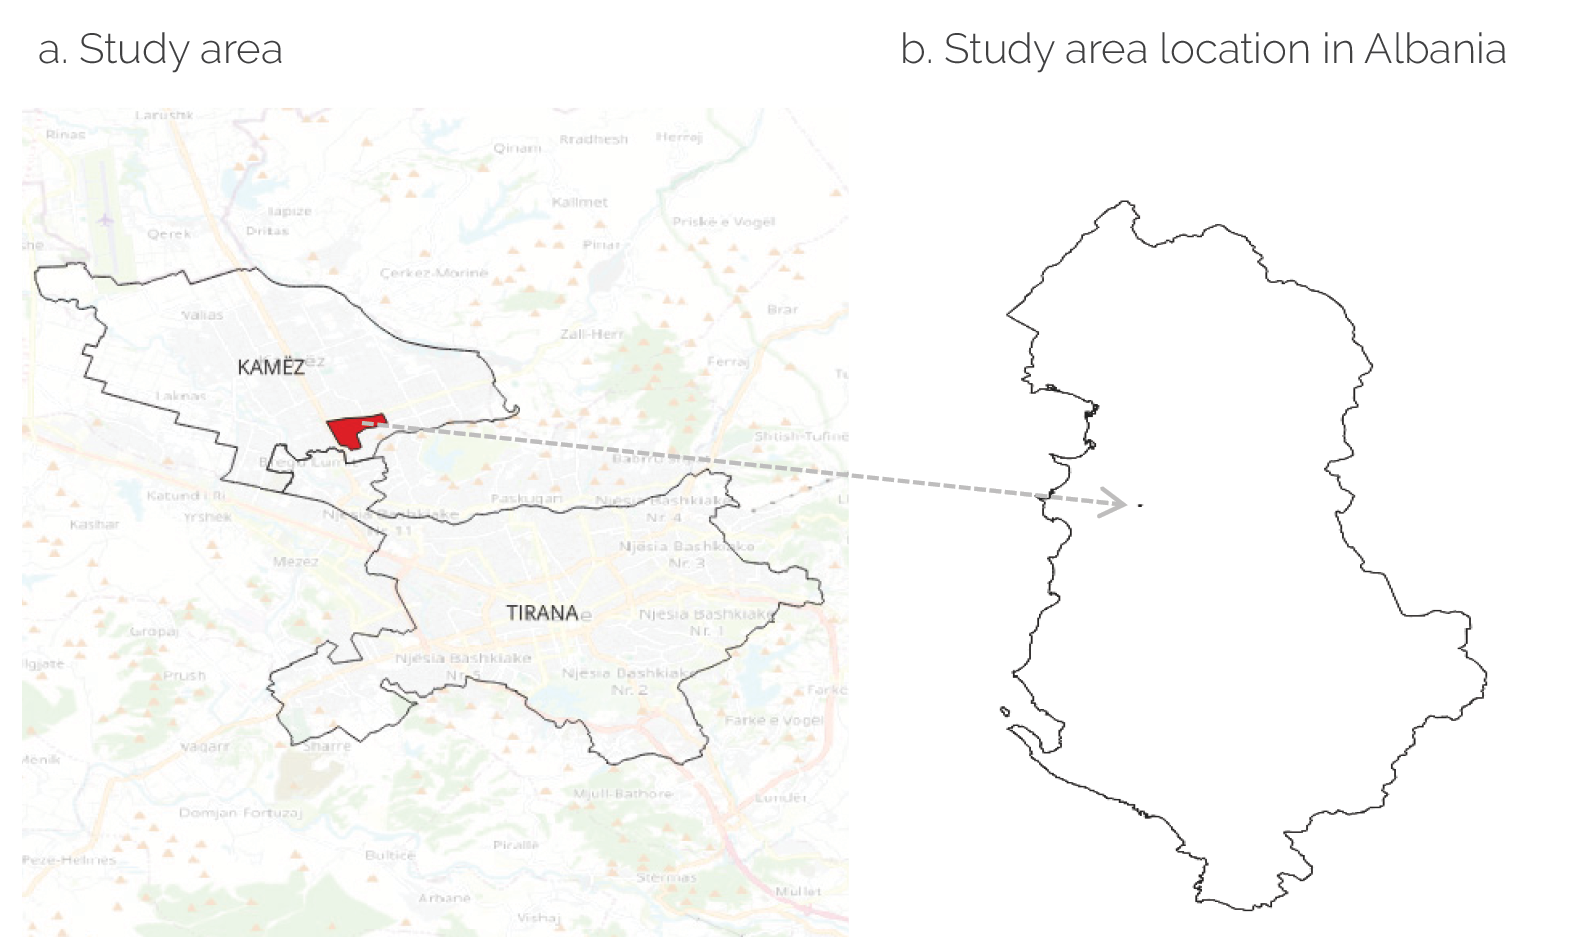
Source: Independent Evaluation Group.
Note: Panel a shows the study area (in red), overlaid on Kamëz’s and Tirana’s current administrative boundaries on a base map from the OpenStreetMap database (for more information, see OpenStreetMap Foundation (accessed October 21, 2022), https://www.openstreetmap.org). Panel b displays the location and extent of the study area within Albania’s national boundaries.
Identification of Appropriate Data Sources
The study’s small area of analysis, coupled with the fact that project implementation started in 1998, made finding compatible data, from both a spatial and a temporal perspective, considerably challenging. Traditional data sources, such as surveys, excluded geocoded observations at the time of project implementation. More important, even if geocoded data had been available for that period, they would likely have lacked a sufficient number of observations that overlapped with the study area. Within this context, imagery data became essential for the analysis because they can help fill gaps in traditional data sources and produce the spatially disaggregated estimates that are required to obtain robust findings.