
World Bank Group Support to Demand-Side Energy Efficiency
Chapter 1 | Background and Context
Highlights
Energy efficiency—a reduction in the energy required to maintain or improve energy services—comprises both supply-side energy efficiency, such as the efficiency of power plants, and demand-side energy efficiency (DSEE), such as the efficiency of buildings.
This evaluation focuses on DSEE for four reasons: (i) DSEE can substantially reduce energy demand, avoiding greenhouse gas emissions that contribute to climate change; (ii) the World Bank Group is in a position to help address the policy, institutional, market, and behavioral barriers that limit DSEE interventions; (iii) the Bank Group committed in the Climate Change Action Plan to scaling DSEE; and (iv) other recent evaluations of the Independent Evaluation Group have addressed supply-side energy efficiency.
DSEE contributes to meeting Sustainable Development Goal (SDG) 13 on combating climate change, the Paris Agreement goals, and the global energy efficiency target under SDG 7. It could also contribute to several other SDGs, including SDG 3 (health), SDG 8 (economic growth, decent work, and productivity), and SDG 11 (sustainable cities and communities).
A serious challenge is that meeting the SDG 7, SDG 13, and Paris Agreement goals requires increasing the annual rate of improvement in energy efficiency globally—the rate at which global gross domestic product per unit of energy used increases—by 2.7 times by 2030. This requires increasing global investment in DSEE from all sources by $500 billion per year to $790 billion annually from now until 2030.
Accelerating the rate of energy efficiency improvement enough to meet the climate goals requires scaling DSEE interventions both vertically (within industries) and horizontally (across industries).
The evaluation aims to assess how well the Bank Group supports client countries in achieving end-use energy savings by scaling DSEE vertically and horizontally. It addresses the effectiveness of the Bank Group’s DSEE interventions, their coherence (both within the Bank Group and with partners), and opportunities for scaling.
Context
Energy efficiency reduces the energy required to maintain or improve energy services to households, businesses, and communities (World Bank 2015). Energy efficiency improves when the same energy services require less energy or when energy services are enhanced using the same amount of energy. For example, an LED bulb that uses less energy than an incandescent bulb to produce the same amount of light is considered more energy efficient (IEA 2014).
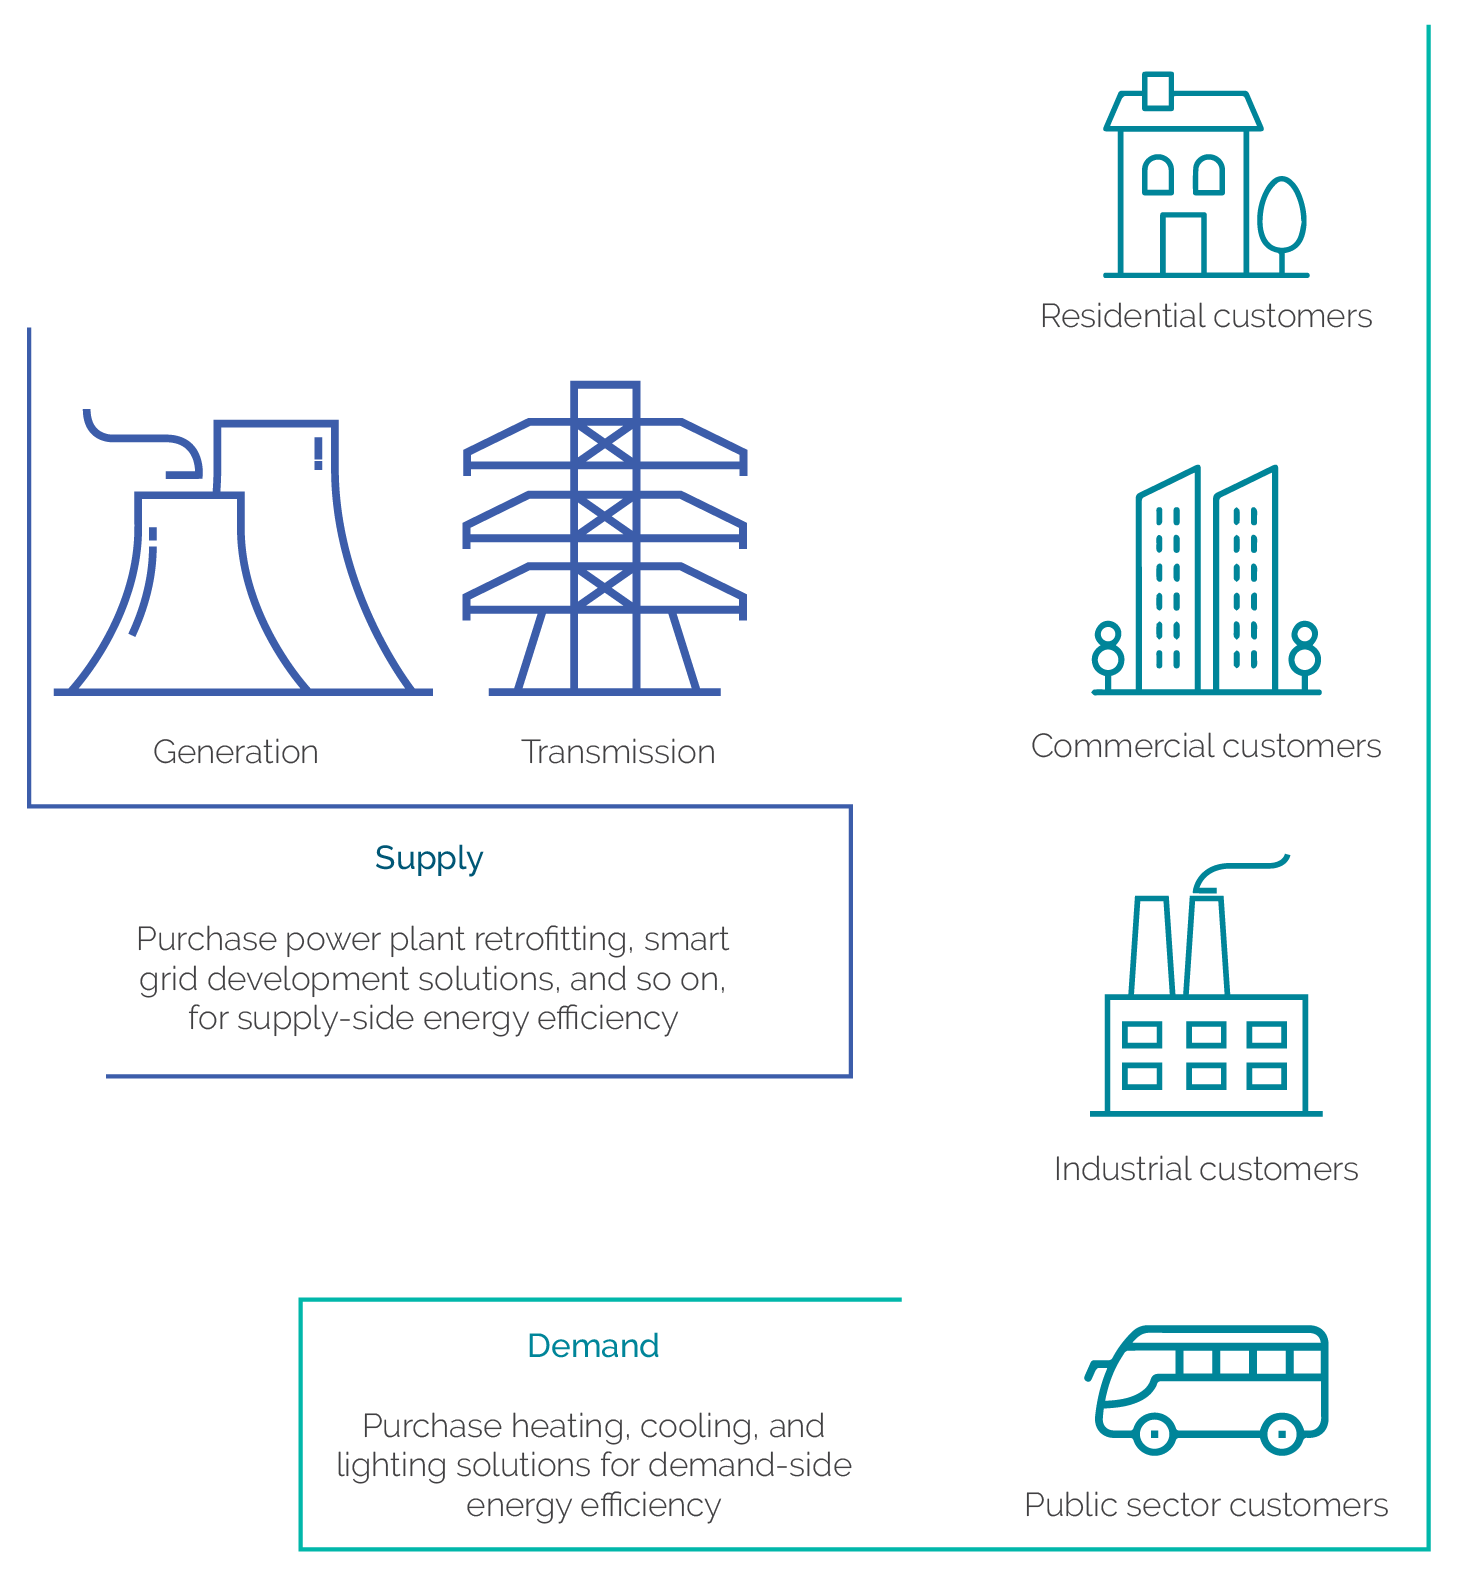
Efforts to improve energy efficiency can be categorized as supply-side approaches and demand-side approaches (figure 1.1). Supply-side energy efficiency (SSEE) approaches target energy generation via grid infrastructure, utilities, and power producers. They include upgrading and retrofitting power plant turbines, efficient transmission lines, and smart-grid applications and so on, reduce energy losses and capture waste heat during energy generation. Demand-side energy efficiency (DSEE) focuses on the energy use of industries, commercial entities, and households. It includes upgrading industrial plants, equipment, and appliances; retrofitting public infrastructure and residential buildings; improving fuel efficiency; and end-user incentives and load-shape modification programs by utilities and service providers. (Cogeneration, such as rooftop solar energy, refers to renewable energy generated for the household rather than to energy efficiency.) The main market segments for DSEE are residential, commercial, industrial, and public sector energy customers.
The evaluation focuses on the World Bank Group’s DSEE approaches for four reasons.
- First, DSEE interventions can substantially reduce energy demand, avoiding greenhouse gas (GHG) emissions. Emissions of carbon dioxide (CO2) and other GHGs into the atmosphere are critical culprits in climate change, and the energy sector is responsible for about three-quarters of the world’s GHG emissions (IEA 2021c). Improvements in DSEE reduce demand and save energy, avoiding fossil fuel consumption and decreasing GHG emissions. More than 40 percent of the reduction in GHG emissions over the next 20 years could come from energy efficiency (IEA 2020a). Global use of LED light bulbs in 2017 alone reduced carbon emissions by 570 million metric tons, nearly 2 percent of total emissions.
- Second, the Bank Group can help address policy, institutional, market, and behavioral barriers that undermine DSEE interventions. Policy and institutional barriers include inadequate or unfavorable regulatory and legal framework and limited infrastructure investment. Market failures include information asymmetries among energy producers and consumers and capital market imperfections that lead to private sector underinvestment in energy efficiency. Behavioral barriers include habits, social norms, lack of trust, and lack of awareness of the economic benefits of energy efficiency measures.
Figure 1.1. Energy Efficiency Supply and Demand

Figure 1.1. Energy Efficiency Supply and Demand
Source: Independent Evaluation Group.
- Third, the Bank Group has committed to scaling up DSEE, including through the recent Country Climate and Development Reports. Scaling up DSEE refers to influencing or increasing clients’ DSEE activities, inputs, or investments across or within sectors. The World Bank Group Climate Change Action Plan 2021–25 identifies energy efficiency as one of the largest untapped opportunities for energy savings and climate mitigation and explicitly calls for scaling it up (World Bank 2021b). DSEE accounts for only one-quarter of the Bank Group energy portfolio (2011–20). The relatively small emphasis on DSEE is partly due to the difficulties in reaching the multiple and fragmented market segments, the limited interest of government counterparts, and—for the International Finance Corporation (IFC)—the challenge of achieving an adequate return on investments in DSEE interventions. The Bank Group takes Nationally Determined Contributions into account in its action plans and the recent Country Climate and Development Reports.
- Fourth, other recent Independent Evaluation Group (IEG) evaluations have covered supply-side issues. Evaluations on supply-side topics include assessments of Bank Group support for energy access and renewable energy (World Bank 2015, 2020).
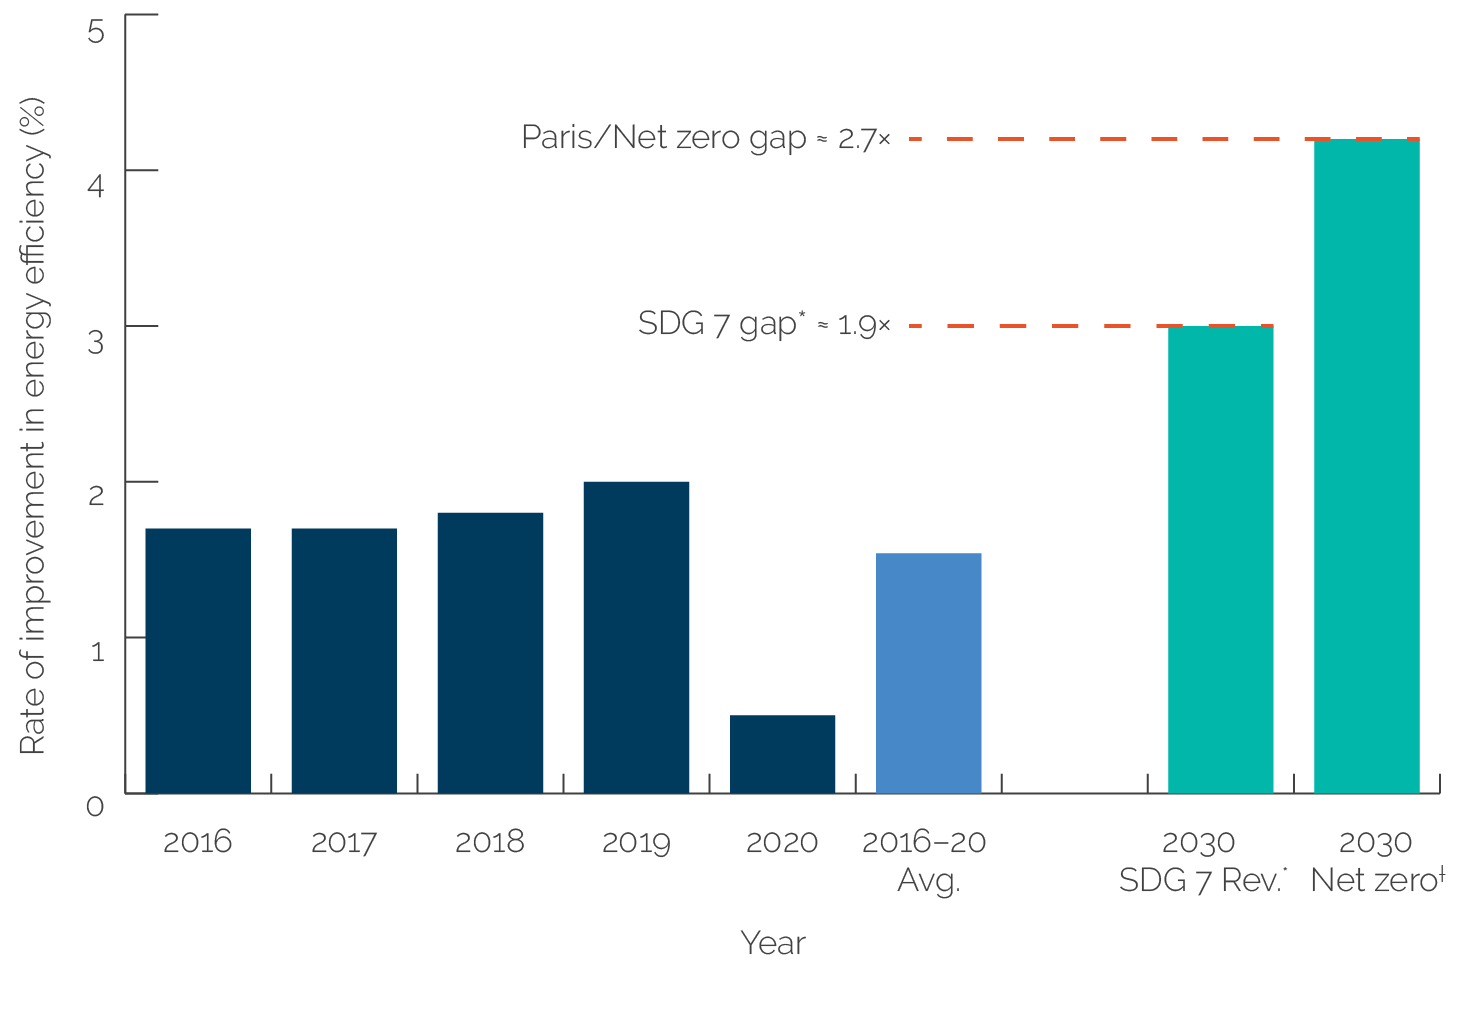
DSEE contributes to Sustainable Development Goal (SDG) 13 on climate change, the Paris Agreement, the target under SDG 7 on improving global energy efficiency, and several other economic and social benefits. In addition to the climate goals, DSEE could contribute to SDG 3 (health), SDG 8 (economic growth, decent work, and productivity), and SDG 11 (sustainable cities and communities). SDG 7 targets doubling the global rate of improvement in energy efficiency (the rate at which global gross domestic product per unit of energy used increases) by 2030. The average annual rate of improvement in energy efficiency between 2016 and 2020 was 1.54 percent (shown in the light-blue bar in figure 1.2). Meeting SDG 7 requires an energy efficiency improvement rate of at least 3 percent annually (SEforALL 2021; 2030 SDG 7 bar in figure 1.2). Meeting the goal would require the global rate of improvement in energy efficiency to increase by approximately 1.9 times from the 2016–20 average (line labeled “SDG 7 gap” in figure 1.2). Moreover, to achieve net zero carbon emissions by 2050, as required by the Paris Agreement, the global rate of improvement in energy efficiency would need to rise to 4.2 percent by 2030 (IEA 2021c). (Net zero emissions is a state in which the GHGs going into the atmosphere are balanced by their removal from the atmosphere, including residual emissions; reaching this target is necessary for halting climate change.) Meeting this goal would require the global rate of improvement in energy efficiency to increase by more than 2.7 times from the 2016–20 average (“Paris/Net zero gap” line in figure 1.2).
Figure 1.2. Global Annual Rate of Energy Efficiency Improvement

Figure 1.2. Global Annual Rate of Energy Efficiency Improvement
Sources: Inernational Energy Agency 2021a; Sustainable Energy for All 2021.
Note: Avg. = average; Rev. = revised; SDG = Sustainable Development Goal.* Revised SDG 7 target.† Required by 2030 to achieve net zero by 2050 per the Paris Agreement.
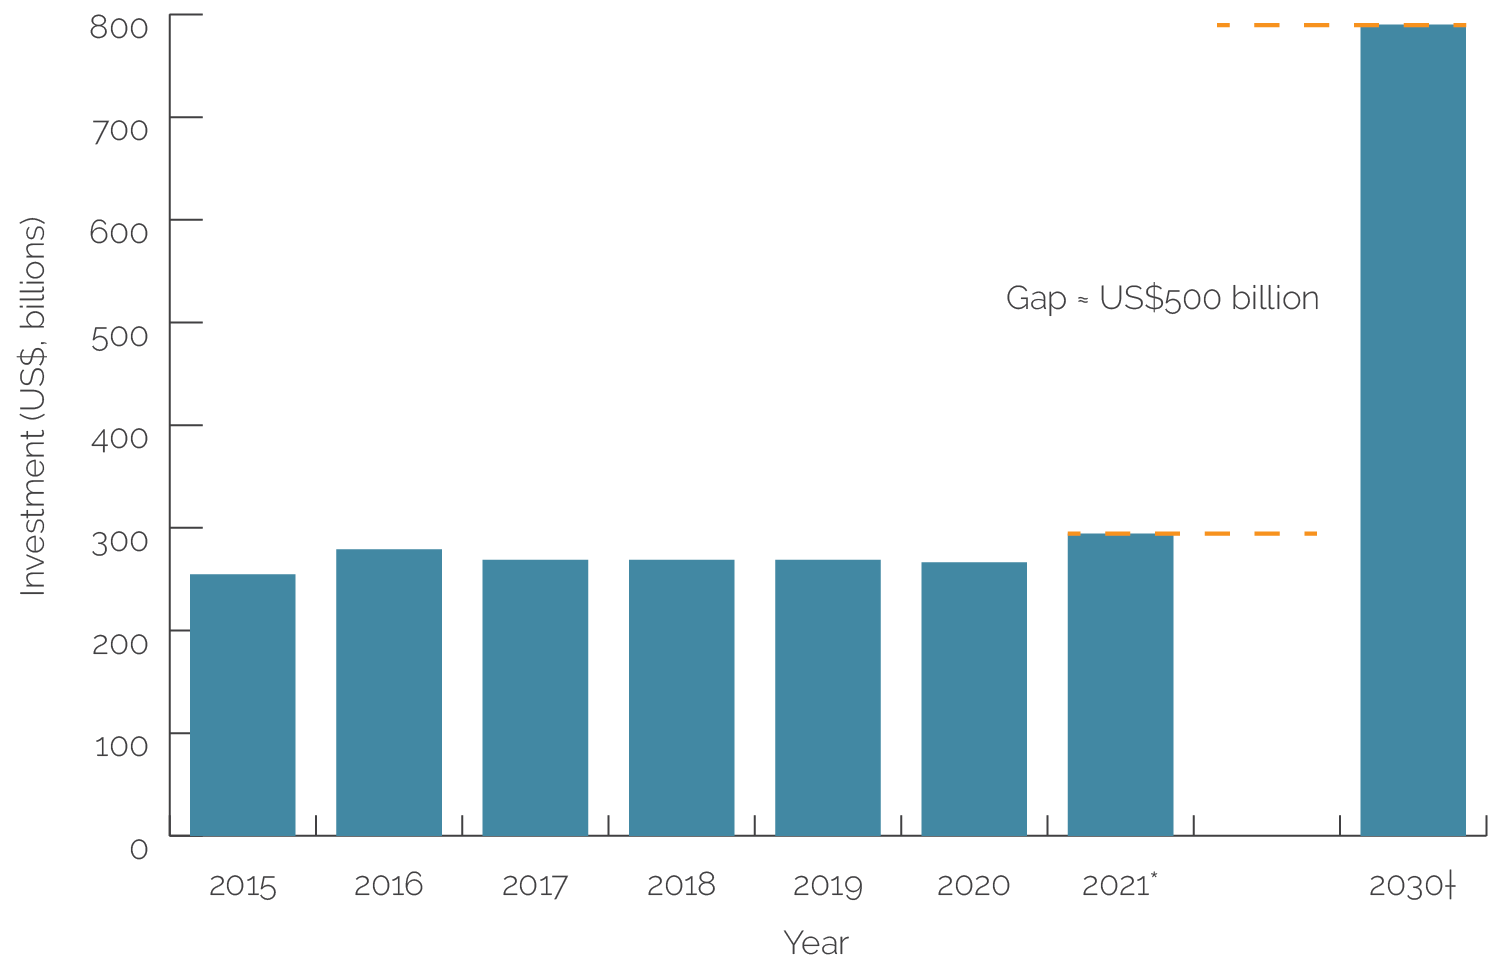
Meeting SDG 7, SDG 13, and the Paris Agreement—and reaping the economic and social benefits associated with energy efficiency—requires a substantial increase in investment. Global annual investments in energy efficiency have been less than $300 billion since 2015 (figure 1.3).1 To increase the rate of improvement in energy efficiency to 4.2 percent, as is required to reach net zero emissions, align with the Paris Agreement, and meet SDG 13 and SDG 7, world energy efficiency investments would need to rise from approximately $290 billion in 2021 to $790 billion annually by 2030—a yearly gap of approximately $500 billion, requiring an increase in investment of more than 2.7 times (IEA 2021a).
Figure 1.3. Global Annual Investment in Energy Efficiency, 2015–21: Past Trends and Future Need

Figure 1.3. Global Annual Investment in Energy Efficiency, 2015–21: Past Trends and Future Need
Source: International Energy Agency 2021a.
Note: An energy efficiency investment is defined as the incremental spending on new energy-efficient equipment or the full cost of refurbishments that reduce energy use. The intention is to capture spending that reduces energy consumption. Under conventional accounting, part of this is categorized as consumption rather than investment.* Estimate.† Projected need.
Addressing climate goals—including SDG 13 and the Paris Agreement—requires scaling DSEE interventions both vertically and horizontally. Vertical scaling introduces DSEE solutions to reduce direct emissions from buildings, factories, vehicles, or other assets belonging to a single sector (table 1.1). An example of vertical scaling in the buildings sector would be going from improving the efficiency of air conditioning systems in a few dozen buildings to improving them in several hundred buildings. Horizontal scaling introduces energy efficiency solutions in multiple sectors, reducing both direct emissions and indirect emissions (emissions that are a consequence of an organization’s activities but occur at sources owned or controlled by another entity). An example of horizontal scaling would be supporting a construction company in reducing not only its own emissions but also the emissions of its customers (by constructing buildings with low energy use and emissions) and partners (such as cement and glass firms, transport and logistics firms, and banks). Both vertical and horizontal scaling can involve scaling across multiple organizations, assets (for example, multiple buildings), and countries.
Table 1.1. Vertical and Horizontal Scaling in Demand-Side Energy Efficiency
|
Vertical Scaling |
Horizontal Scaling |
|
|
Emissions targeted |
Direct emissions |
Direct plus indirect emissions |
|
Sectors targeted |
Single sector |
Multisector |
|
Other aspects of scale |
Multiorganization, multi-asset, multicountry |
|
Source: Independent Evaluation Group.
In addition to addressing climate goals, energy efficiency plays a key role in partly mitigating the short- and long-term effects on energy security arising from the war between the Russian Federation and Ukraine in the Europe and Central Asia Region and beyond. Roughly one-third of the gas demand of the European Union (EU) is used for heating buildings across various market segments (for example, industrial, commercial, household) and another one-third for electricity production (Det Norske Veritas 2022). Almost 20 percent of EU gas demand comes from the manufacturing industry and the remainder from the petrochemical industry. European policy makers are determined to slash the EU’s dependence on Russian gas by two-thirds by the end of 2022. European energy security ambition therefore hinges on additional policy measures on both energy supply and energy demand. On demand, beyond nudging end-user (especially household) behavior toward lower energy use, there is scope for a concerted policy push for energy efficiency via multisectoral approaches (for example, joint energy-transport approaches) and budget support. Scaling DSEE in the Europe and Central Asia Region and beyond will mitigate the long-term negative impact of dependence on Russian gas. Only about 1 percent of the EU’s building stock is renovated each year (OECD 2022). A rapid extension to an additional 0.7 percent, targeting the least energy-efficient buildings across various market segments (industrial, commercial, and household), would save more than 1 billion cubic meters of gas use per year and increase employment.
The COVID-19 pandemic and the consequent global economic downturn have intensified the relevance and urgency of improving energy efficiency. The COVID-19 pandemic has (i) reduced the ability of households to pay for DSEE upgrades, given the loss of income associated with the decline in economic activity, and (ii) slowed down the financing of DSEE solutions as national priorities have changed. As a result, even greater efforts will be needed to meet the energy efficiency savings and climate change targets in a post–COVID-19 world (IEA 2020a).
During the COVID-19 pandemic, there has been greater recognition of DSEE’s role in reducing pressure on public budgets and achieving socioeconomic impacts such as increases in productivity and job creation. The various analyses of (i) the ecological links among emissions reduction, air quality, DSEE adoption, COVID-19 mortality rates, and health (Wu et al. 2020); (ii) DSEE’s relationship to job creation and industrial productivity (IEA 2020b); and (iii) the relationship between energy-efficient living conditions through DSEE and vulnerable household incomes (Eurofound 2016) suggest that DSEE offers wide fiscal and socioeconomic benefits beyond energy-use savings and reduction of GHG emissions.
Evaluation Purpose, Questions, and Methods
The overall purpose of this evaluation is to assess how well the Bank Group is supporting client countries in achieving end-use energy savings by scaling DSEE vertically and horizontally. This report addresses three specific evaluation questions and subquestions:
- How effective have the Bank Group’s DSEE interventions been in achieving the development outcome of end-use energy savings?
- How coherent are the Bank Group’s DSEE interventions (i) internally (for example, coordination and joint initiatives across World Bank Practice Groups and IFC sectors) and (ii) externally (for example, across development partners and client governments)?
- What untapped opportunities and mechanisms exist for the Bank Group to support clients to realize their energy efficiency potential? (i) What are the untapped opportunities for Bank Group engagement to support energy efficiency across sectors? (ii) What innovative mechanisms proved effective and sustainable and can be mainstreamed to scale DSEE interventions?
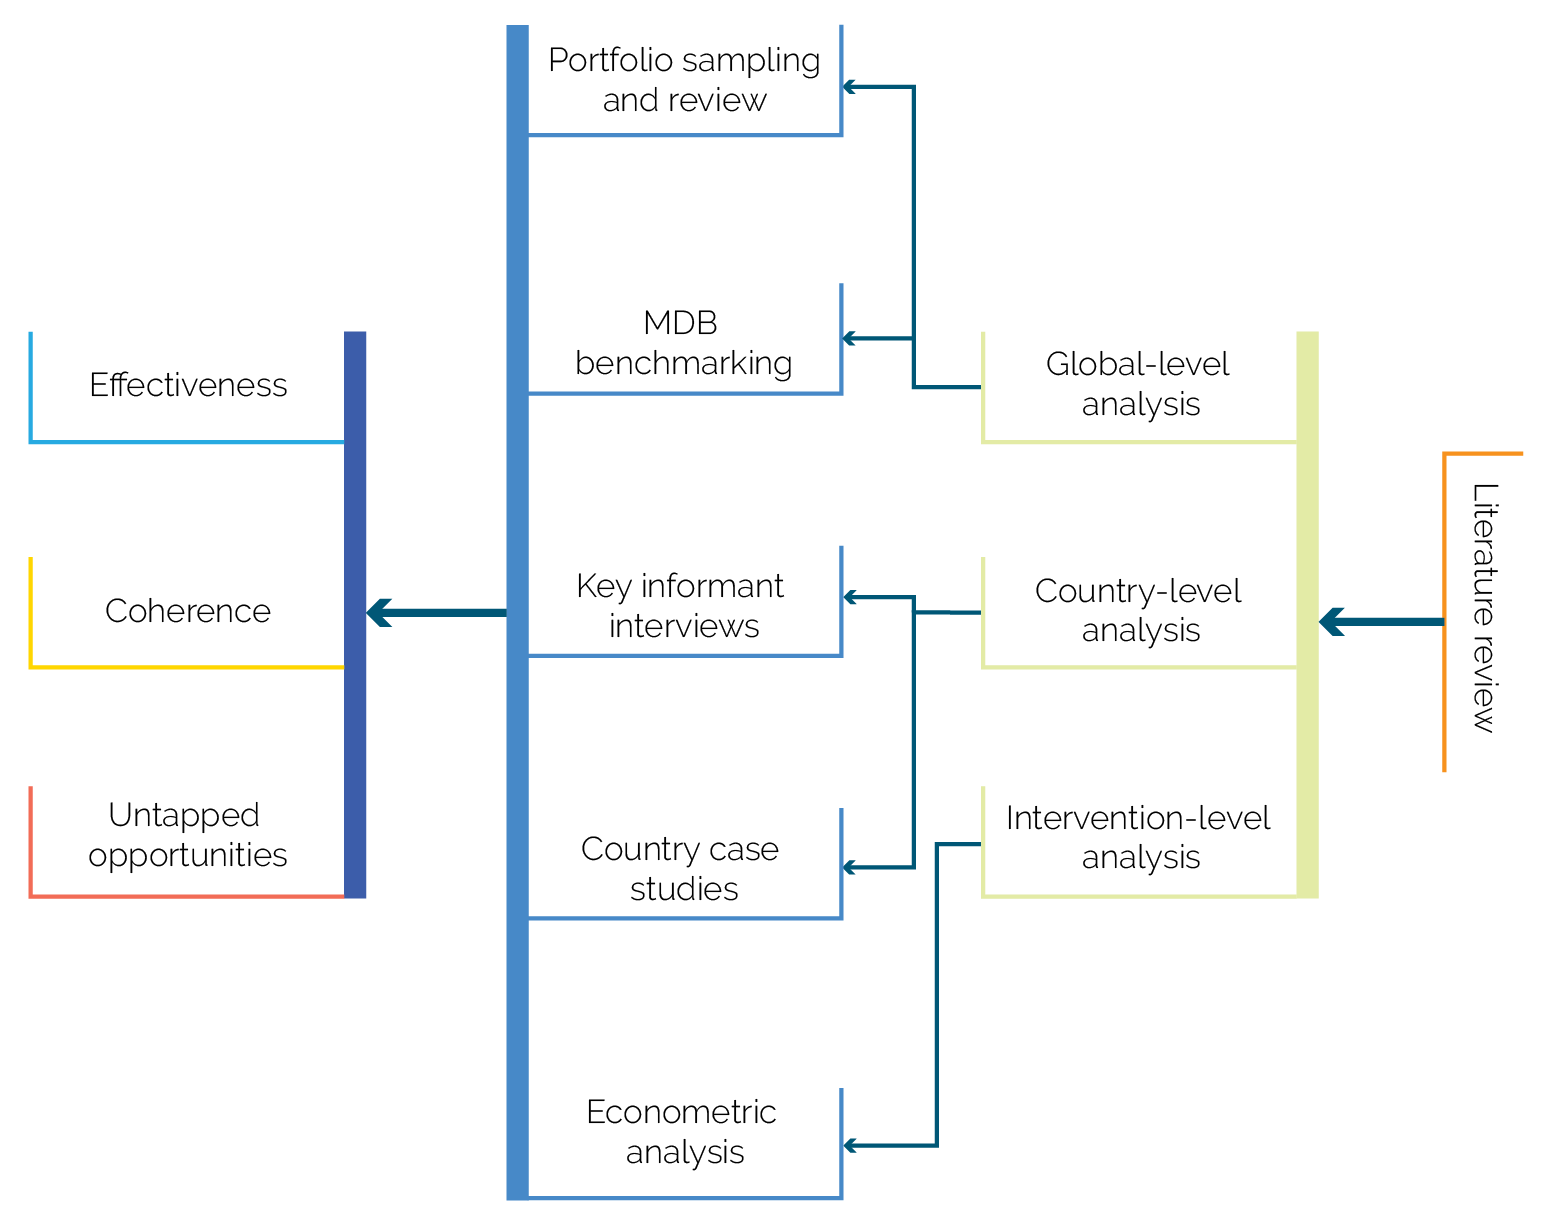
The evaluation was conducted at the global, country, and intervention levels. This evaluation is part of the climate change and environmental sustainability theme in IEG’s work program. The evaluation addressed the evaluation questions through a combination of methods: literature review, portfolio sampling, multilateral development bank (MDB) benchmarking, key informant interviews, country case studies, and econometric analysis (figure 1.4; see appendix A for methodology). The third evaluation question was answered based on best practices from within the Bank Group and through a literature review and analysis of existing surveys outside the Bank Group.
The evaluation team conducted a portfolio analysis of Bank Group energy efficiency projects supporting (i) demand-side-only interventions and (ii) both supply-side and demand-side interventions. The team also selected a subsample of both categories of projects for a deep-dive analysis of outcomes. The evaluation team at first identified 562 Bank Group energy efficiency projects. Out of this portfolio universe, the team identified 408 projects with demand-side-only energy efficiency components (for example, IFC investment services) or a combination of SSEE and DSEE components (for example, World Bank development policy financing [DPF]). Out of 408 projects, the evaluation team could not ascertain the commitment-value equivalent for 54 World Bank advisory services and analytics (ASA) projects. The evaluation team sampled 133 projects out of 354 (408 total portfolio minus 54 ASA projects) across the three institutions for a deep-dive analysis of outcomes (refer to appendix A for more details). The IFC project outcome analysis was based on IFC project self-evaluations and IEG validations. The self-evaluations are selected based on a randomly stratified sample from all approved and committed projects.
The evaluation team included both investment project financing (IPF) and development policy loans in the World Bank lending portfolio but accounted for them differently. The evaluation team included in the portfolio the total number of IPFs that supported DSEE and their full loan commitment amounts. The team also included in the portfolio the total number of development policy operations (DPOs) that supported DSEE, but only the share of the loan commitment amounts specifically related to prior actions supporting DSEE. The share of DPOs’ commitments included in the portfolio as specifically supporting DSEE prior actions was approximately $3 billion (20 percent of the DPOs’ total commitment amount of $15 billion).
Figure 1.4. Mapping Evaluation Questions to Evaluation Methodologies and Techniques

Figure 1.4. Mapping Evaluation Questions to Evaluation Methodologies and Techniques
Source: Independent Evaluation Group.
Note: MDB = multilateral development bank.