
Results and Performance of the World Bank Group 2022
Chapter 3 | International Finance Corporation and Multilateral Investment Guarantee Agency Project-Level Performance
Highlights
Development outcome ratings of recently evaluated International Finance Corporation (IFC) investment projects have improved slightly, from 47 percent in 2017–19 to 48 percent in 2018–20 and to 52 percent in 2019–21. By region, investment projects in South Asia and Central Asia and Türkiye outperformed projects in other regions, especially Africa, whose development outcome ratings declined further in 2019–21. Development outcome ratings of projects in fragile and conflict-affected situations (FCS) have weakened, with only 21 percent of evaluated projects rated mostly successful or higher on development outcome.
Development effectiveness ratings of IFC advisory services projects have improved in 2019–21. Development effectiveness ratings of projects in International Development Association countries outperformed projects in non–International Development Association countries, while success ratings of advisory services projects in FCS continue to improve, though projects in non-FCS have a higher development effectiveness rating.
Development outcome ratings of recently evaluated Multilateral Investment Guarantee Agency (MIGA) guarantee projects improved substantially, with 70 percent of projects rated satisfactory or better in 2016–21, compared with 66 percent in 2015–20 (from a previous high of 69 percent in 2013–18), but only two out of eight projects were rated in 2021 program. Development outcome ratings of projects in FCS have also held steady since 2015–20, but development outcome ratings of projects in International Development Association countries continue to weaken.
Work quality and role and contribution are both important aspects for IFC and MIGA in improving development results. MIGA’s role and contribution rating reached an all-time high in 2016–21 (with the caveat that the 2021 MIGA self-evaluation and validation program is ongoing, with only two out of eight projects rated so far). For IFC investments, IFC’s returns also suffer when projects have poor development outcomes.
International Finance Corporation Investment Projects
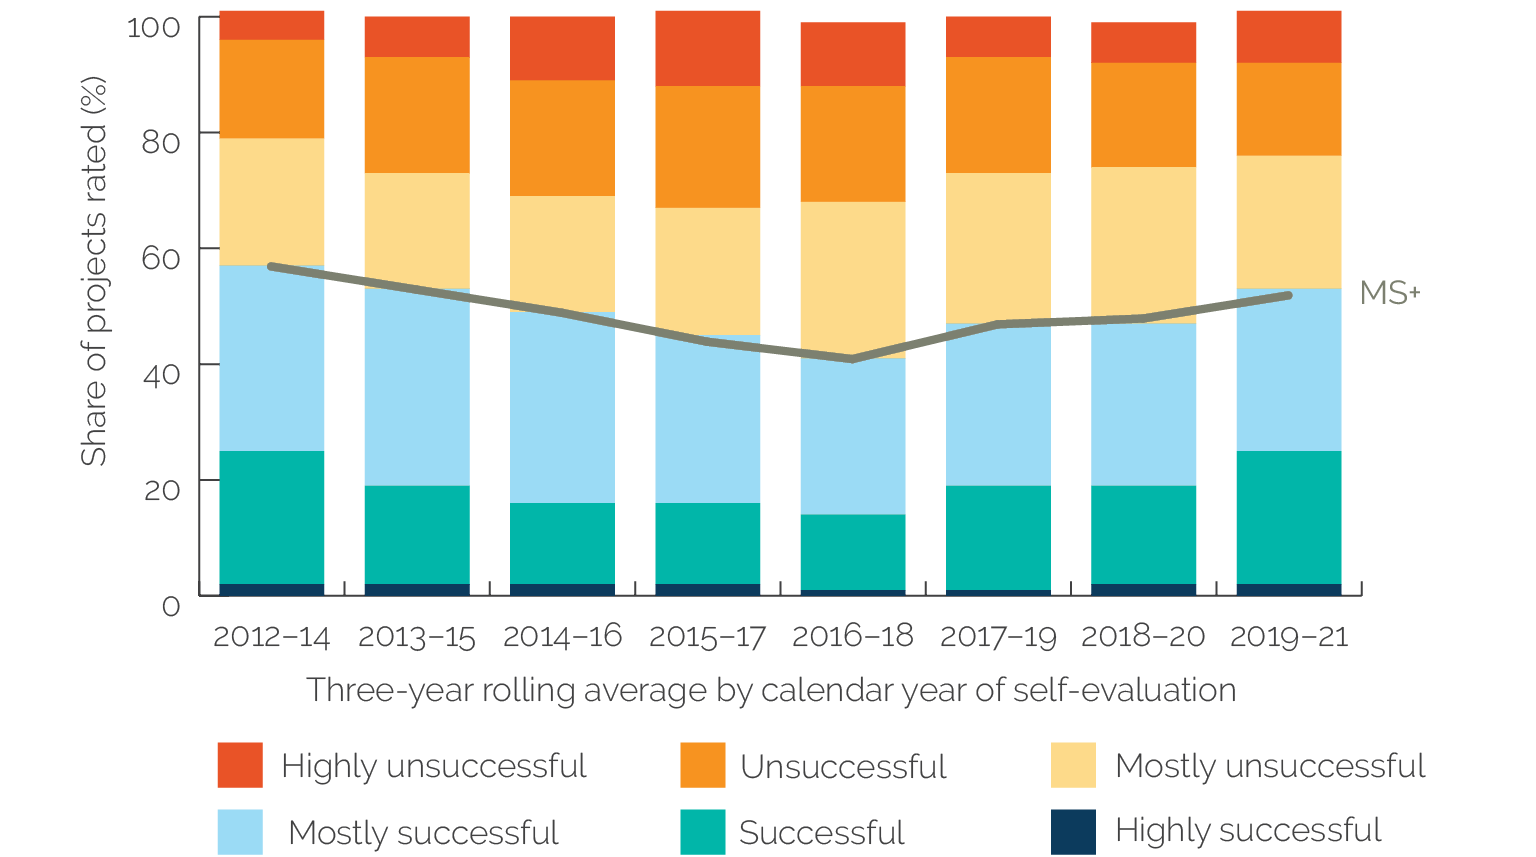
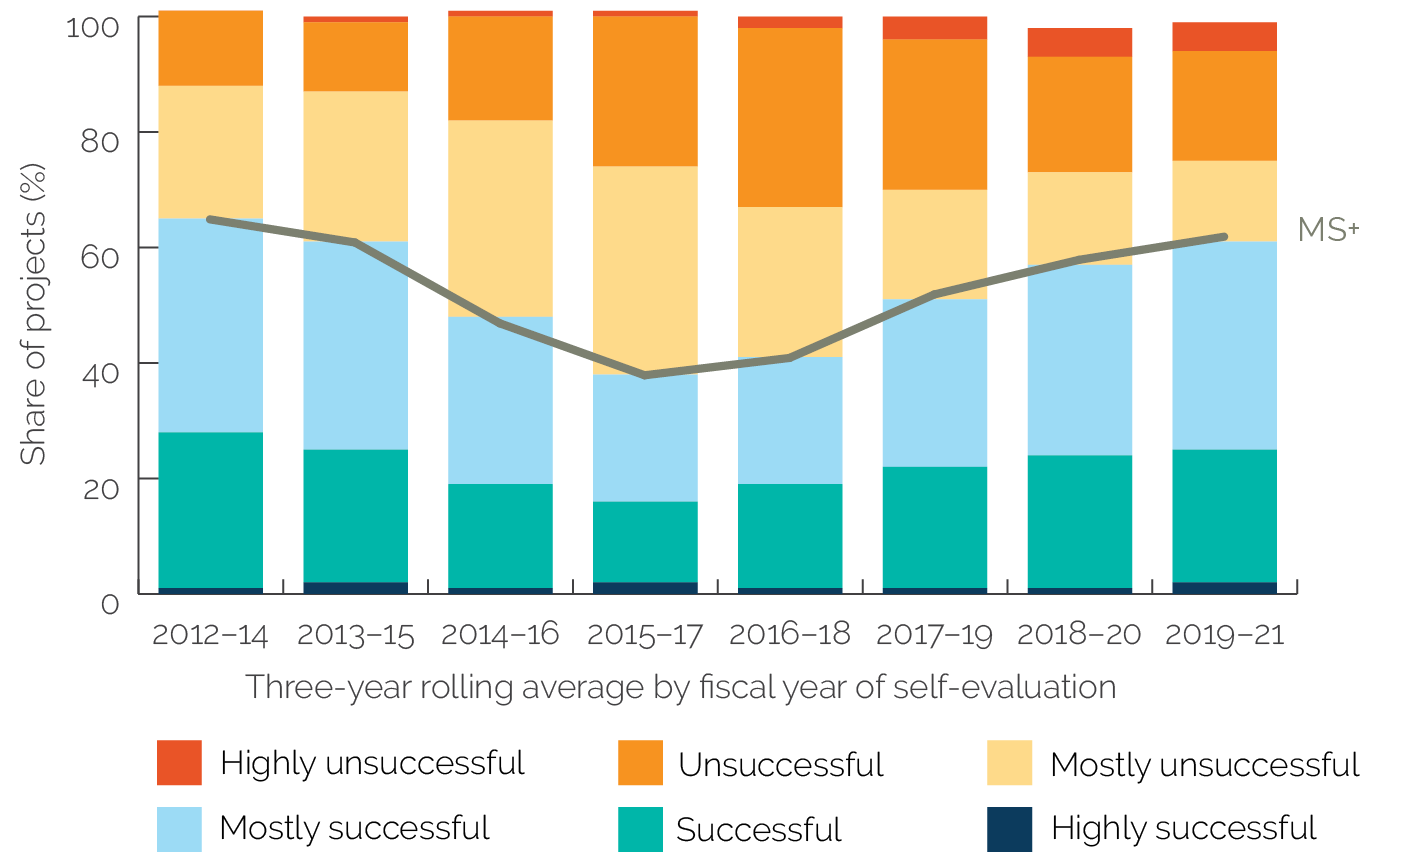
Development outcome ratings of recently evaluated IFC investment projects have improved slightly. Fifty-two percent of investment projects evaluated during the calendar years 2019–21 were rated, on average, mostly successful or higher, compared with 48 percent during the previous three-year period (2018 to 2020) and 47 percent in 2017–19. The overall improvement was aided by an increase in the share of projects rated successful and the gradual decline in projects rated unsuccessful from 2015 to 2017 (figure 3.1). However, the overall development outcome ratings at the lower end of the rating scale (highly unsuccessful) increased in the 2019–21 period. On an annual basis, the share of projects rated highly unsuccessful in 2020 and 2021 reached 13 percent and 10 percent, respectively—a substantial increase from the 4 percent of projects with a similar rating in 2019 and 2018 (appendix E). The share of projects rated highly unsuccessful in 2012–21 averaged 9 percent of all evaluated projects during that period. By contrast, the average share of projects with highly successful development outcome ratings held steady at 2 percent of all projects evaluated in 2012–21.
Figure 3.1. Overall Development Outcome Ratings, 2012–21

Figure 3.1. Overall Development Outcome Ratings, 2012–21
Source: Independent Evaluation Group data.
Note: This figure is based on 809 Expanded Project Supervision Report Evaluation Notes completed between 2012 and 2021, of which 14 projects were rated highly successful and 69 were rated highly unsuccessful on development outcome. One project has a rating of no opinion possible and was excluded from the count. MS+ = mostly successful or higher.
Projects with highly successful development outcome ratings also have high ratings on IFC’s work quality, on IFC’s role and contribution or additionality to the project and the client, and in exceeding IFC’s expected investment returns. Only 14 of 808 evaluated projects in 2012–21 are rated highly successful,1 compared with 69 projects with highly unsuccessful development outcome ratings. Highly successful projects have excellent ratings on their business performance and economic sustainability and received either an excellent or satisfactory rating on the projects’ environmental and social (E&S) effects and in promoting development of the private sector. Eight of the projects rated highly successful were medium-size investments.2 Three of the 4 equity investments projects with highly successful development outcome ratings involved greenfield projects, which goes against the historic underperformance of projects involving greenfield investments.3 Five of the 14 projects rated highly successful were financed by a combination of IFC loan and equity, 5 projects received IFC loans, and IFC provided only equity investment in 4 projects. However, unlike most projects financed by equity investments (which tend to have low development outcome ratings), in the 4 highly successful equity projects, IFC had the right strategic partner who maintained good synergy and a good working relationship with IFC throughout the investment and benefited from IFC’s close supervision. Highly successful equity projects also gained from an enabling policy environment or at least neutral regulatory framework and from more open market access. These aspects point to the high work quality of the IFC investment team at appraisal and structuring and during monitoring and supervision. IFC’s financial additionality through sound structuring of IFC financing and mobilizing financing were most common, and IFC’s nonfinancial value added was mainly in the form of the introduction of new and better standards of corporate governance, E&S compliance, and operational aspects. Projects with highly successful development outcome ratings are also rated highly for exceeding IFC’s investment return expectations.
Conversely, projects with highly unsuccessful development outcome ratings were also rated poorly on IFC’s work quality, IFC’s role and contribution, and the lower-than-expected investment return to IFC. Projects with highly unsuccessful development outcome ratings were rated unsatisfactory for their project business performance and economic sustainability and either unsatisfactory or partly unsatisfactory in fostering private sector development. Highly unsuccessful projects are also noncompliant with IFC’s E&S Performance Standards. Most of the projects involved either equity investments (32 of 69 projects) or loans (28 or 69 projects) that did not meet IFC’s expected gross returns.4 In contrast with equity investment projects with highly successful outcome ratings, the quality of IFC’s screening, appraisal and structuring, and supervision and administration of projects rated highly unsuccessful were mostly rated either unsatisfactory or partly unsatisfactory. Although IFC took a risk in investing equity in projects with sponsors that had weak track records, adequate risk mitigation measures were lacking. Poor due diligence of the project sponsor, coupled with a weak risk assessment and risk mitigation plan by the IFC investment team, is common among equity investment projects with highly unsuccessful development outcome ratings. Highly unsuccessful equity investment projects have poorly defined project scope, with implementation timelines that resulted in considerable time and cost overruns and the sponsors taking a much more aggressive investment strategy that caused financial and operational problems. Corporate governance problems were also common in several equity investment projects rated highly unsuccessful. Government policy distortions weakened the business and operating environment of most equity projects rated highly unsuccessful. The low ratings in IFC’s role and contribution to the project and the client reflect the failure to address the weaknesses inherent in these projects.
Despite some contrasting features, investment projects rated at the extreme ends have diverse characteristics, which limits generalizability. The investment projects rated at the extreme ends are too diverse to identify patterns in addition to the few unique characteristics described in the previous two paragraphs. Projects rated highly successful and highly unsuccessful are in FCS, International Development Association (IDA), non-FCS, or non-IDA countries or in the same region or same industry group. Most of the projects rated at the extreme ends involved medium-size investments (8 of 14 projects rated highly successful and 41 of 69 projects rated highly unsuccessful). Five of 14 projects rated highly successful are in Africa, and at the opposite end, 23 percent (16 of 69) of projects rated highly unsuccessful are also in the Region. The Latin America and the Caribbean Region had the highest share of projects rated highly unsuccessful (17 of 69, or 25 percent), followed by projects in Africa. By IFC industry group, 6 of 14 projects rated highly successful were in Infrastructure and Natural Resources, but 42 percent (29 of 69) of projects rated highly unsuccessful were also in that industry group, which has the highest share of projects with highly unsuccessful development outcome ratings by industry group. Five of 14 projects rated highly successful were in the Manufacturing, Agribusiness, and Services industry group; at the same time, 21 of 69 (30 percent) projects rated highly unsuccessful were also in this industry group. A review of the project approval dates for projects rated at the extreme ends shows that both sets of projects share similar approval and commitment years. For example, there were projects rated highly successful and highly unsuccessful approved in 2007, 2008, 2009, and 2010 (the years of the global financial crisis).
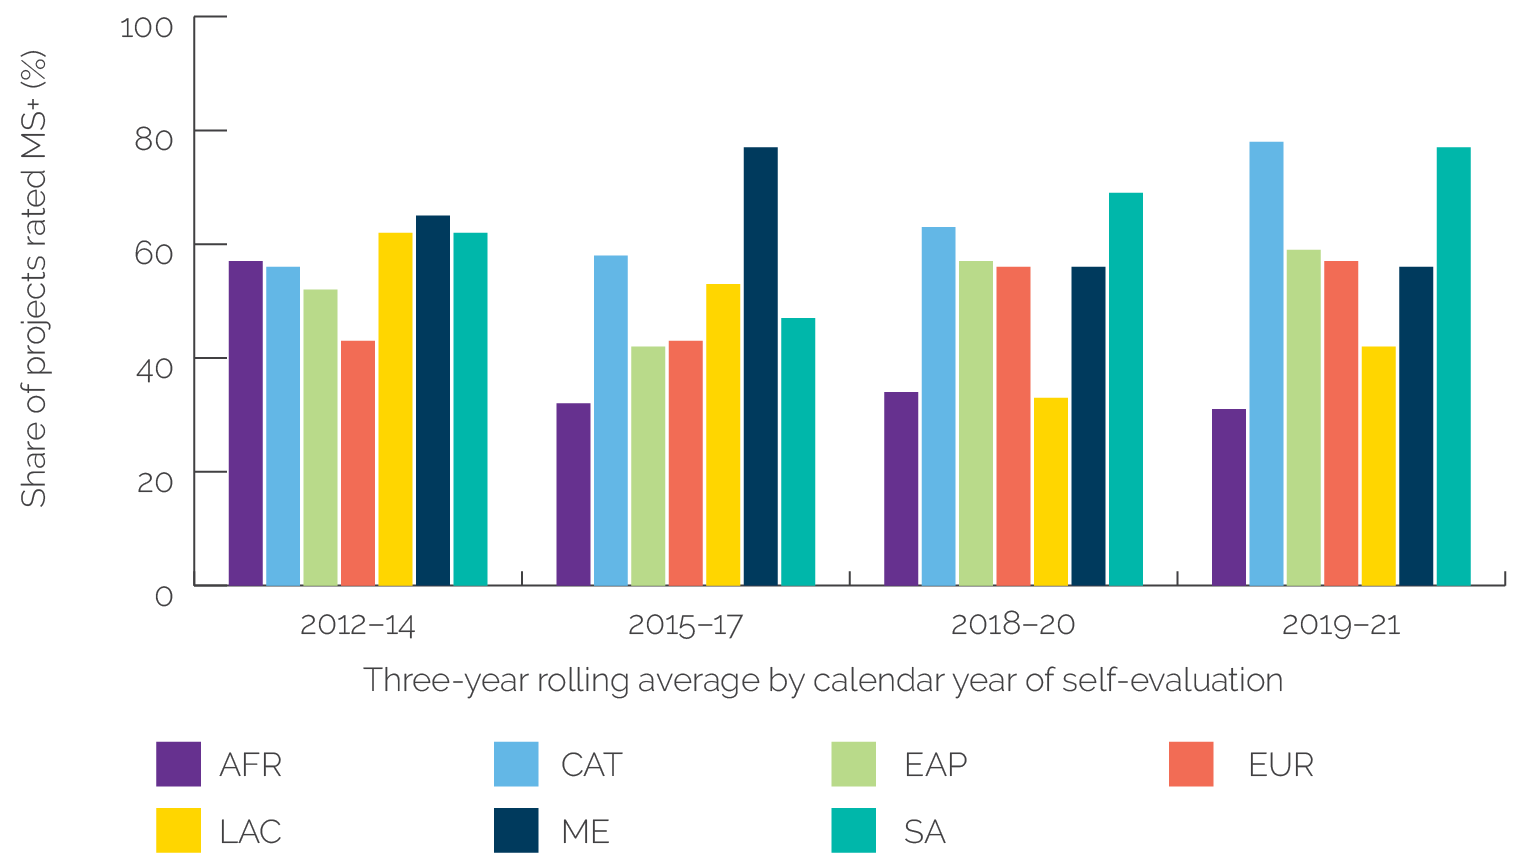
Using IFC’s new regional classification, projects in Central Asia and Türkiye and in South Asia outperformed projects in other regions, especially projects in Africa, whose development outcome ratings have declined further in the past three years. In 2019–21, 7 of the 9 evaluated projects in Central Asia and Türkiye and 20 of 26 projects (77 percent) of evaluated projects in South Asia were rated mostly successful or higher on their development outcome (figure 3.2). By contrast, 31 percent of evaluated projects in Africa in 2019–21 were rated mostly successful or higher on development outcome, down slightly from 34 percent in 2018–20 but a significant decline from 57 percent in 2012–14. In 2019–21, nearly half of the mostly unsuccessful or lower rated projects in Africa were in the Manufacturing, Agribusiness, and Services industry group; most of these projects are in the health, education, and life sciences subsector.5 Additionally, more projects by the Financial Institutions Group in Africa were rated mostly unsuccessful or lower on development outcome in 2019–21. Several of the Financial Institutions Group projects involved IFC special programs (particularly IFC’s Risk-Sharing Facility) with local banks to provide local currency financing to small and medium enterprises. Experience so far indicates that the use of this first-loss guarantee facility has been challenging and unsuccessful.6
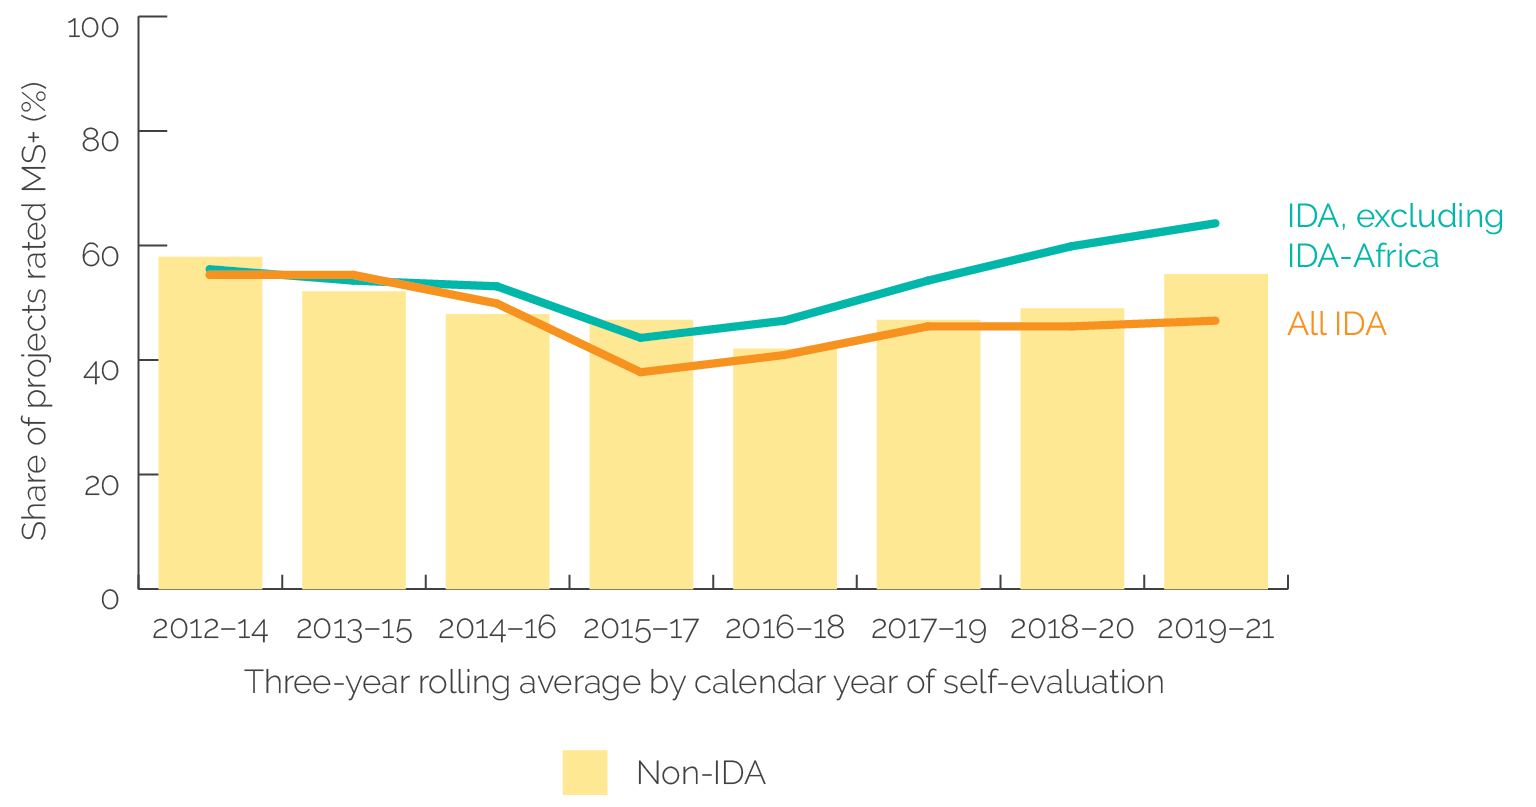
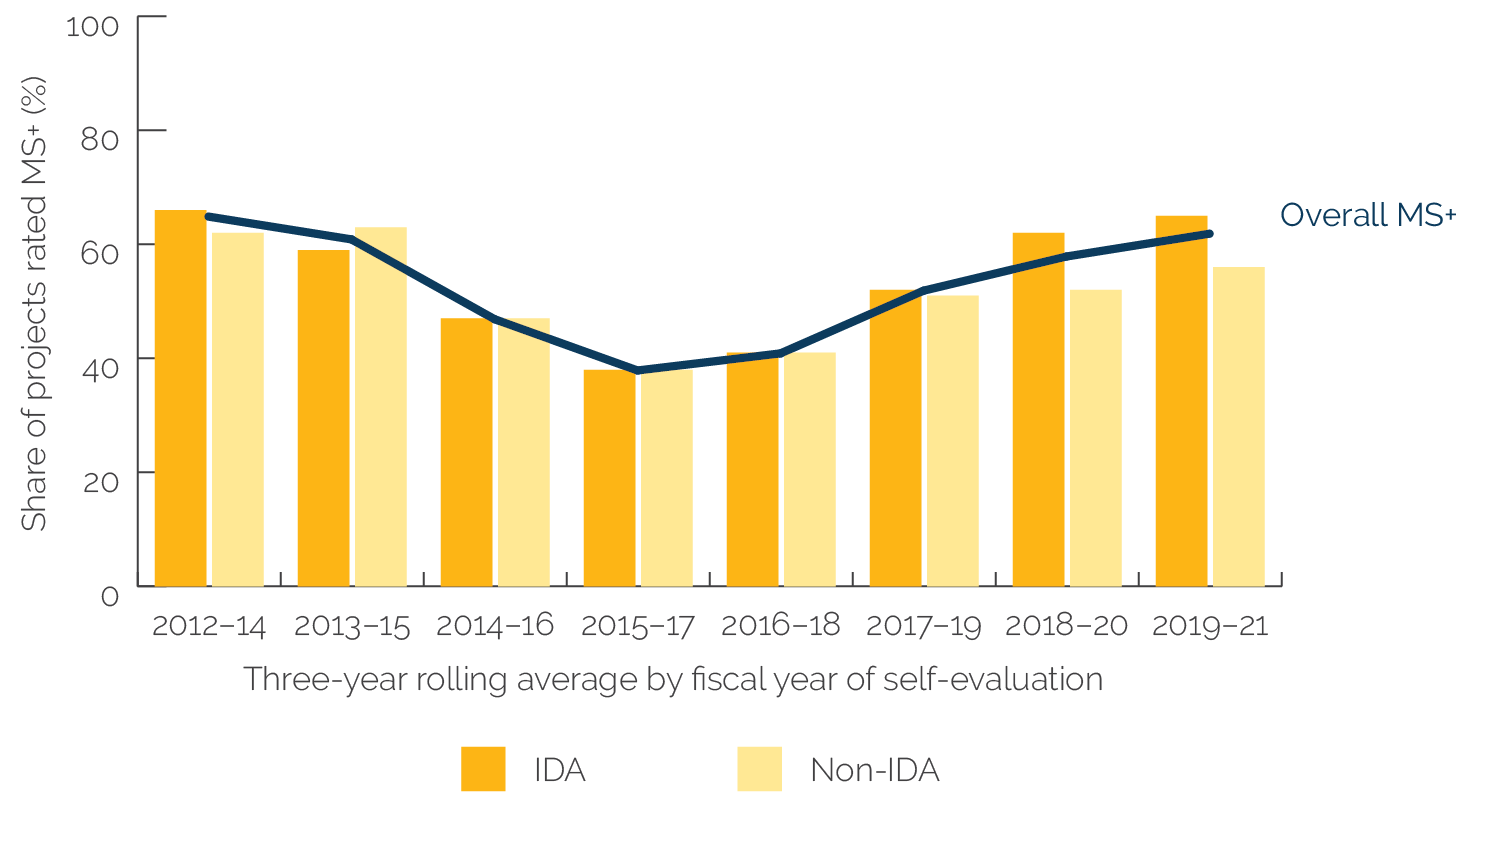
The declining development outcome rating of projects in the Africa Region constrains overall IDA outcome ratings. The overall development outcome success rates of projects in IDA held steady in 2017–19 because of improvements in the development outcome ratings of projects in non-IDA Africa. Projects in non-IDA Africa have better development outcome ratings than projects in IDA Africa. Development outcome ratings of projects in non-IDA Africa countries have recovered from 44 percent in 2015–17 to 70 percent in 2019–21 because of improvements in the development outcome ratings of IFC’s equity investments and small-size investment projects in non-IDA Africa countries.7 If IDA Africa projects ratings are excluded, the development outcome ratings of projects in IDA would be higher, which suggests that an improvement in the development outcome ratings of projects in IDA Africa is likely to make a difference in the results and performance of IFC projects in IDA countries (figure 3.3).
Figure 3.2. Share of MS+ Development Outcome Ratings, by IFC Region, 2012–21

Figure 3.2. Share of MS+ Development Outcome Ratings, by IFC Region, 2012–21
Source: Independent Evaluation Group data.
Note: Excludes 22 evaluated investment projects implemented across different regions or world projects. Afghanistan and Pakistan are grouped in the Middle East region in IFC’s September 2021 regional classification. AFR = Africa; CAT = Central Asia and Türkiye; EAP = East Asia and the Pacific; EUR = Europe; IFC = International Finance Corporation; LAC = Latin America and the Caribbean; ME = Middle East; MS+ = mostly successful or higher; SA = South Asia.
Figure 3.3. Development Outcome Ratings of Projects in IDA and Non-IDA Countries, 2012–21

Figure 3.3. Development Outcome Ratings of Projects in IDA and Non-IDA Countries, 2012–21
Source: Independent Evaluation Group data.
Note: Of the 809 investment projects evaluated in calendar years 2012–21, 270 are in IDA countries, of which 158 are in non-IDA Africa countries and 539 evaluated projects are in non-IDA countries. IDA country classification is based on the year of International Finance Corporation investment commitment. IDA = International Development Association; MS+ = mostly successful or higher; AFR = Africa.
IFC’s work quality ratings of projects in the Africa Region have plateaued recently and lag projects in other regions. IFC’s work quality represents an assessment of its operational performance, including assessment of E&S work; IFC’s up-front work in screening, appraisal, and structuring; and its monitoring and supervision after project approval by the Board of Executive Directors and subsequent IFC commitment. Although the work quality rating of projects in Africa has recovered from its low point in 2015, it still lags other regions (see appendix E, figure E.3, panel b). Ratings in the quality of IFC’s project screening, appraisal, and structuring—especially financial sector projects—are low, with 36 of the 86 projects rated partly unsatisfactory or lower and followed by projects in the agribusiness and forestry subsector (12 of 86 projects have low ratings). By contrast, more projects in Central Asia and Türkiye and in South Asia are rated satisfactory or higher for IFC’s work quality,8 especially in the quality of screening, appraisal, and structuring of projects.
Work quality affects projects’ development outcome ratings. Among all projects evaluated in 2012–21, the likelihood of the project receiving a successful development outcome rating is low (7 percent) when the project has a poor work quality rating (partly unsatisfactory or lower; appendix E, figure E.4). Regarding the two dimensions of IFC’s work quality, a high rating on the quality of supervision and administration increases the likelihood of a successful development outcome by 44 percent, and the chance of a successful development outcome rating is slim (at 6 percent) if the quality of monitoring and supervision is also rated unsatisfactory. Effective monitoring and supervision ensure that risks are addressed during implementation and that the client and project meet IFC’s requirements and provide IFC with a chance to offer its knowledge and expertise to the project and client. However, if the rating on IFC’s screening, appraisal, and structuring is low, there is a 34 percent chance that a project will also receive a low development outcome rating. This aspect of IFC’s work quality reflects IFC’s due diligence conducted on the project and the sponsor, as well as the structuring of the project in a manner that mitigates risks and ensures that the sponsor meets IFC’s requirements. Therefore, IFC’s work quality matters both at the front end (screening, appraisal, and structuring) and at implementation (supervision and administration). The association is stronger in projects that are rated at the low end of the rating scale—84 percent of projects rated low (unsatisfactory) on work quality are rated highly unsuccessful on development outcome (appendix E, figure E.4), and there is no chance of getting a high development outcome rating if IFC’s work quality is rated unsatisfactory.
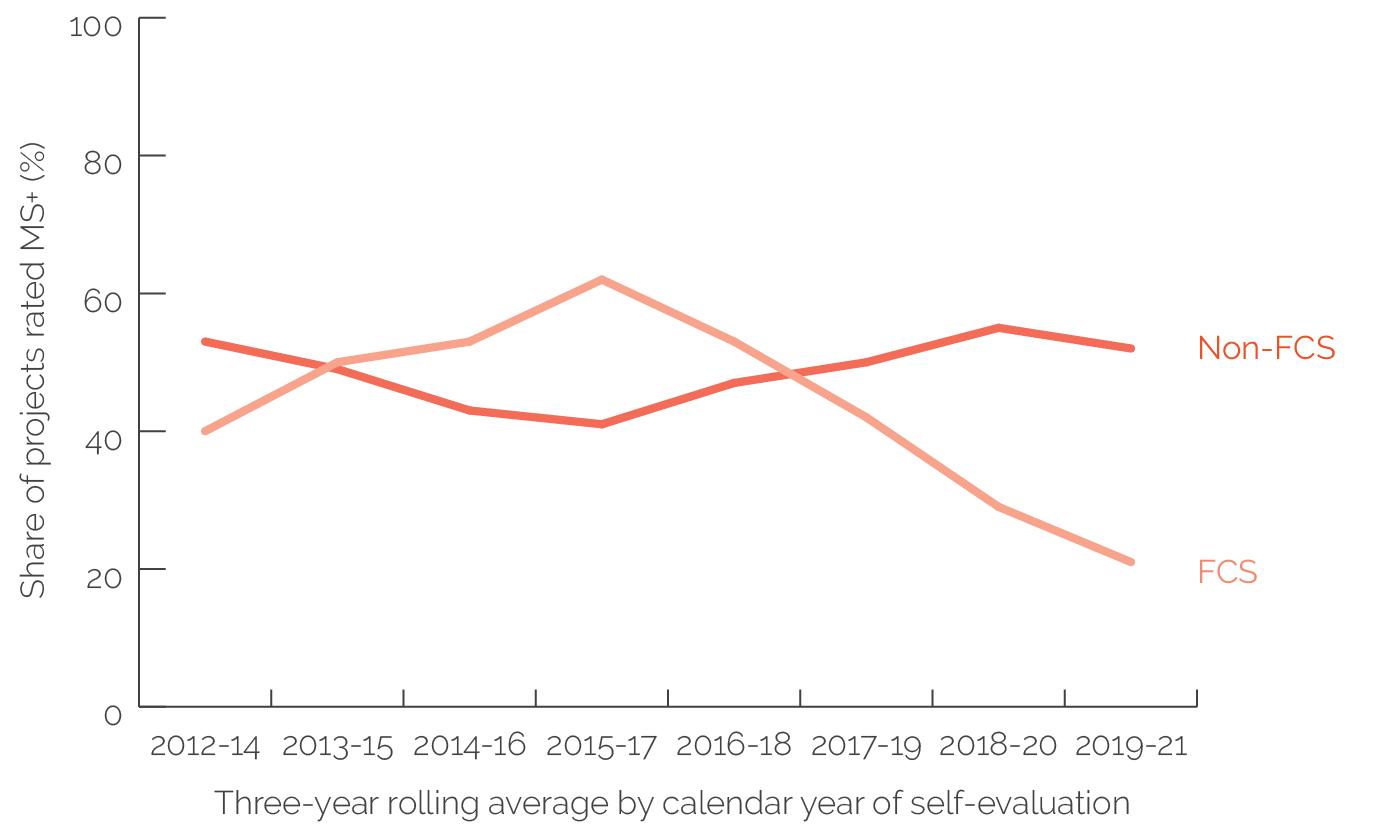
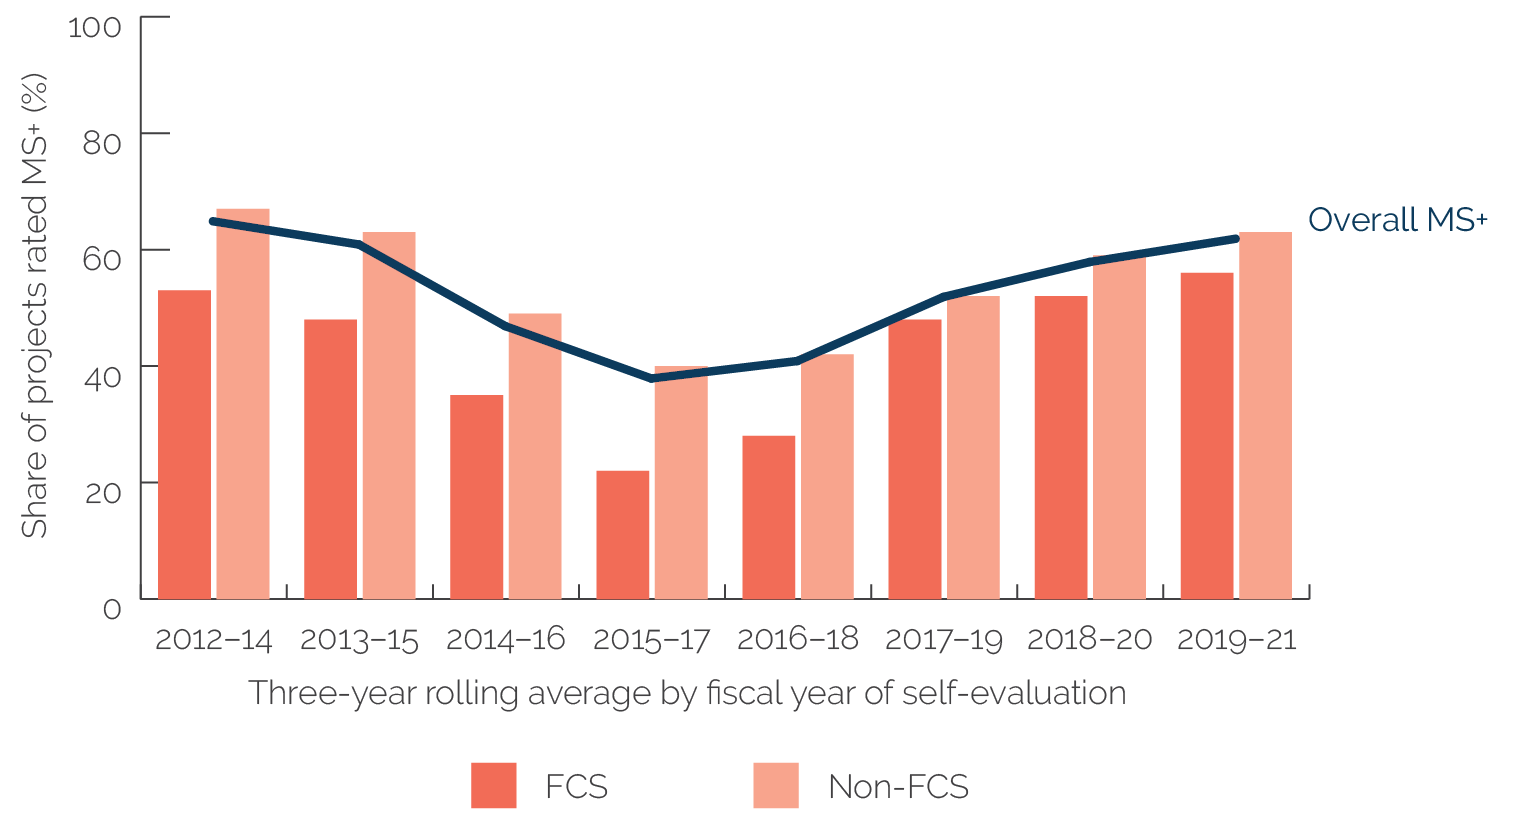
Development outcome ratings of projects in FCS have weakened. Despite the small number projects in evaluated between 2012 and 2021,9 the development outcome trend for projects in FCS has been declining in recent years (figure 3.4). Low development outcome ratings of projects in FCS, an IFC corporate priority, can be observed across all industries, by size of investment commitment and type of IFC investment instrument. Projects in FCS have weak ratings across all four indicators of development outcome—business performance, economic sustainability, E&S effects, and private sector development—compared with projects in non-FCS. World Bank (2022b) found that more infrastructure projects in FCS evaluated during 2010–17 were rated successful because of project sponsors or project developers with global experience and broader access to capital and that the larger the investment size, the higher the likelihood of achieving positive development outcomes. This finding holds true for FCS projects in earlier years, but there has been a gradual reversal of this trend since 2017, although IFC has introduced several initiatives and instruments in FCS. In the past five years, more large infrastructure projects in FCS were rated mostly unsuccessful or lower, thus contributing at least partially to the decline in the overall development outcome ratings of projects in FCS. By contrast, large infrastructure projects in non-FCS showed improved development outcome ratings, which exacerbated the divergence in development outcome ratings between projects in FCS and non-FCS in the past five years.
Figure 3.4. Development Outcome Ratings of Projects in FCS and Non-FCS, 2012–21

Figure 3.4. Development Outcome Ratings of Projects in FCS and Non-FCS, 2012–21
Source: Independent Evaluation Group data.
Note: Of the 809 investment projects evaluated in calendar years 2012–21, 56 are in FCS and 753 are in non-FCS. Nineteen of the 216 investment projects evaluated in 2019–21 are in FCS and 197 are in non-FCS. Nineteen projects in FCS were evaluated in 2019–21, of which 4 are rated MS+. FCS = fragile and conflict-affected situations; MS+ = mostly successful or higher.
IFC’s additionality rating remains stable and closely associated with development outcome ratings. IFC considers additionality essential to achieving development impact, whether in the form of delivering positive outcomes to stakeholders or helping create or develop markets. Sixty percent of evaluated investment projects during the 10-year period 2012–21 benefited from both financial and nonfinancial value added from IFC, while nearly one-third had only financial additionality from IFC, mostly in the form of financial structuring of the transaction. In 2019–21, projects rated satisfactory or higher for IFC’s additionality reached 61 percent, compared with 58 percent in 2018–21.10 Results for 2019–21 indicate that projects in the Europe, Central Asia and Türkiye, and East Asia and the Pacific regions; the Manufacturing, Agribusiness, and Services and the Infrastructure and Natural Resources industry groups; non-FCS; and projects involving large investments financed by IFC loans have a higher share of satisfactory or higher IFC’s additionality ratings than their respective cohorts. On average, there is only a 7 percent likelihood that projects with low IFC’s additionality ratings will also have successful development outcomes (appendix E, figure E.7, panel a). However, the association between development outcome and IFC’s additionality ratings is closer among projects rated at the two extreme ends of the ratings scale (appendix E, figure E.7, panel b), where there is a 91 percent chance of receiving a low development outcome rating if the additionality that IFC planned to deliver is rated low, or a zero chance of rating successful on development outcome if IFC’s additionality is rated unsatisfactory.
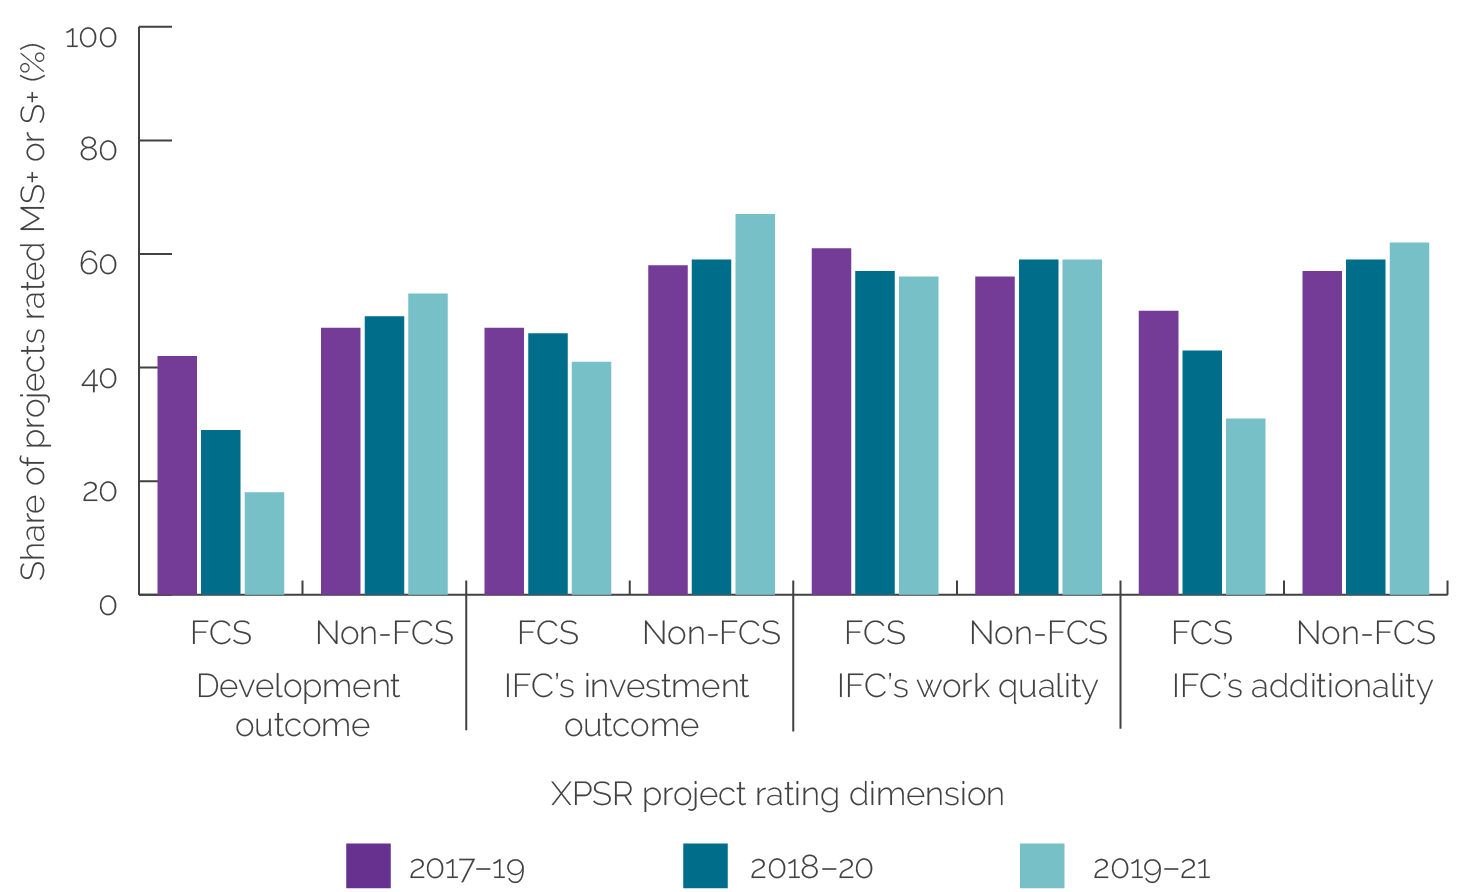
IFC’s additionality ratings of projects in FCS have also declined, while work quality ratings remained steady. IFC’s additionality is the unique benefit or value addition that IFC brings to a private sector client, a project, or a client country that is not typically offered by commercial sources of finance.11 A premise of IFC’s support to FCS is that it can provide value added through financial and nonfinancial means that other financiers are unable to provide. However, only 32 percent of projects in FCS during 2019–21 are rated satisfactory or higher for IFC’s unique value added that it planned to deliver to the project and the client, compared with 62 percent of projects rated satisfactory or higher among non-FCS projects (figure 3.5). Half of the projects in FCS benefited from a combined financial and nonfinancial value added from IFC, mostly in the form of financial structuring of the IFC investment and in assisting clients with adopting new or better business, corporate governance, and E&S standards.12 Projects in FCS also have lower ratings than projects in non-FCS in supervision and administration, one of two indicators of IFC’s work quality, and that has a greater effect on overall work quality and IFC’s investment outcome ratings.
Figure 3.5. Development Outcome, Investment Outcome, Work Quality, and IFC’s Additionality Ratings in FCS and Non-FCS

Figure 3.5. Development Outcome, Investment Outcome, Work Quality, and IFC’s Additionality Ratings in FCS and Non-FCS
Source: Independent Evaluation Group data.
Note: Development outcome is rated on a six-point rating scale (highly successful, successful, mostly successful, mostly unsuccessful, unsuccessful and highly unsuccessful). IFC’s investment outcome, work quality, and additionality are rated on a four-point rating scale (excellent, satisfactory, partly unsatisfactory, and unsatisfactory). FCS = fragile and conflict-affected situations; IFC = International Finance Corporation; MS+ = mostly successful or higher; S+ = satisfactory or higher; XPSR = Expanded Project Supervision Report.
Overall IFC’s investment outcome success ratings are higher than the ratings for development outcomes, suggesting that even projects with weak development outcomes met IFC’s investment returns benchmarks. At the project level, IFC’s investment outcome measures the extent to which IFC has realized and expects to realize, over the remaining life of the investment, the loan or equity returns that were expected at approval.13 In 2019–21, 64 percent of projects were rated satisfactory or higher for their investment outcome, an improvement from the 57 percent of projects rated satisfactory or higher in 2018–20 (appendix E, figure E.9, panel a). By contrast, 52 percent of projects were rated mostly satisfactory or higher on their development outcome in 2019–21, an improvement from the 48 percent success rate in 2018–20. The association between IFC’s investment outcome and development outcome ratings is reflected in appendix E, figure E.10, panel a, which shows that among all evaluated projects in 2012 to 2021, there is a 41 percent likelihood that developmentally successful projects also bring good returns to IFC, but there is only an 8 percent likelihood that projects can be rated successful on development outcome if IFC’s investment outcome ratings in projects is low. The association between development outcome and IFC’s investment outcome ratings is closer among projects rated at the two extreme ends of the ratings scale (appendix E, figure E.10, panel b), indicating that the chance of achieving a successful development outcome is zero if the investment returns to IFC are low. Projects in higher-income countries have better investment outcome ratings compared with projects in IDA countries, FCS, and Africa (particularly Sub-Saharan Africa), and returns from the former group offset low returns in the latter—the premise of IFC’s portfolio approach. The improving share of investment outcome satisfactory or higher ratings can be explained partly by the significant improvement in investment outcome ratings of projects in the East Asia and the Pacific region—from 45 percent rated satisfactory or higher in 2015–17 to 72 percent in 2019–21, which is now on par with the investment outcome ratings of projects in the Europe and South Asia regions.
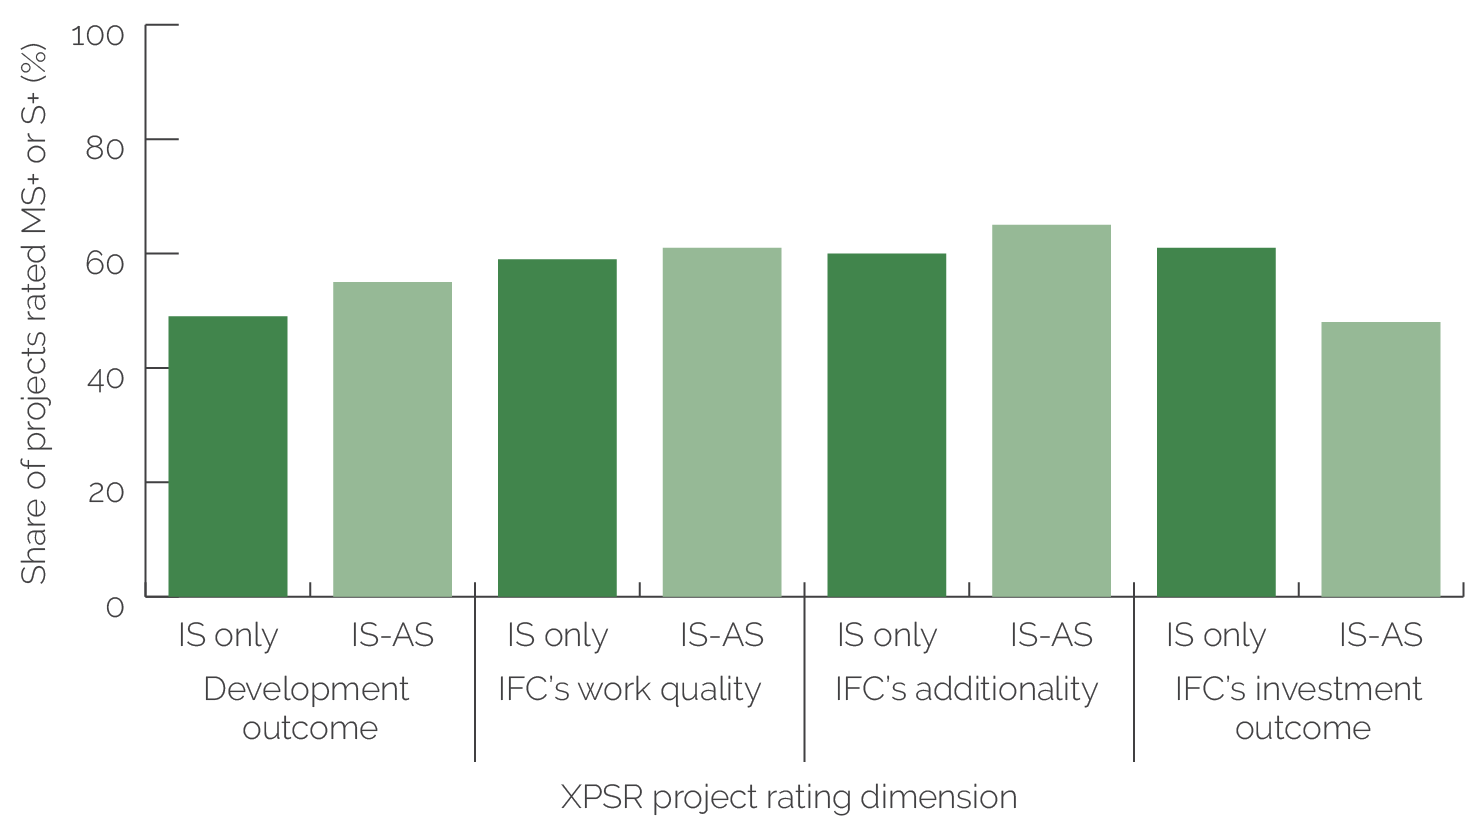
Investment projects with IFC advisory services support slightly improved the investment project’s development outcome and additionality ratings but not IFC’s investment outcome rating. During 2012–21, 69 evaluated IFC investment projects benefited from prior or simultaneous implementation with IFC advisory services support. On average, 55 percent of these linked IFC investment services and advisory services projects were rated mostly satisfactory or higher, compared with the 49 percent ratings for all the evaluated stand-alone IFC investment projects in the same period (figure 3.6). Work quality of evaluated IFC investment projects implemented with advisory services projects have, on average, a slightly higher percentage of satisfactory or higher ratings (61 percent), compared with 59 percent for all IFC investment projects during the 10-year period. On average, investment services and advisory services linked projects show 65 percent satisfactory or higher IFC’s additionality ratings compared with 60 percent satisfactory or higher ratings for stand-alone IFC investment projects. However, an IFC investment project paired with an IFC advisory services project before or simultaneously with an IFC investment has a lower IFC’s investment outcome rating, suggesting that deploying advisory services may help enhance development outcome and IFC’s additionality but has some trade-offs when it comes to realizing IFC’s expected investment returns and therefore must be considered selectively, particularly advisory projects that are paired with only equity investment from IFC. Most of the investment services–advisory services projects with low investment outcome ratings (16 of 36 projects) received only equity investment from IFC, which partly explains the weak investment outcome ratings.
Figure 3.6. IFC Investment Projects with Advisory Services Projects Tend to Have Better Development Outcomes and IFC’s Additionality

Figure 3.6. IFC Investment Projects with Advisory Services Projects Tend to Have Better Development Outcomes and IFC’s Additionality
Source: Independent Evaluation Group data.
Note: Development outcome is rated on a six-point rating scale (highly successful, successful, mostly successful, mostly unsuccessful, unsuccessful and highly unsuccessful). IFC’s investment outcome, work quality and additionality are rated on a four-point rating scale (excellent, satisfactory, partly unsatisfactory, and unsatisfactory). AS = advisory services; IS = investment services; IFC = International Finance Corporation; MS+ = mostly successful or higher; S+ = satisfactory or better; XPSR = Expanded Project Supervision Report.
International Finance Corporation Advisory Services
Development effectiveness ratings of evaluated IFC advisory services projects have stabilized since the 2015–17 period. In 2019–21,14 62 percent of advisory services projects were rated mostly successful or higher on development effectiveness, a significant recovery from their lowest level of 38 percent in 2015–17 (figure 3.7). The improved development effectiveness success rating comes mainly from the increase in the share of projects rated mostly successful or higher. The share of projects rated mostly unsuccessful on development effectiveness has declined. Projects rated at the extreme ends (highly successful and highly unsuccessful) and the share of projects rated successful have remained relatively stable and are thus unlikely to have contributed to the recent positive trend. Year-on-year development effectiveness ratings also recovered from a 23 percent success rate (mostly successful or higher) in 2016 to 65 percent in 2019 before declining to 56 percent in 2021 (appendix E, figure E.11).
Figure 3.7. IFC Advisory Services Projects’ Development Effectiveness Ratings

Figure 3.7. IFC Advisory Services Projects’ Development Effectiveness Ratings
Source: Independent Evaluation Group data.
Note: Based on 574 IFC advisory services evaluated between fiscal years 2012 and 2021, as of July 7, 2022. Eight projects are rated highly successful, and 13 are rated highly unsuccessful on development effectiveness. One project had a rating of not applicable and was not included in this and other graphs. There were 154 projects evaluated in fiscal years 2019–21, of which 95 were rated mostly successful or higher on development effectiveness. IFC = International Finance Corporation; MS+ = mostly successful or higher.
The South Asia and Central Asia and Türkiye regions have a higher share of projects rated mostly successful or higher on development effectiveness than other regions. In 2019–21, 18 of 20 evaluated projects in South Asia and 7 of 9 evaluated projects in Central Asia and Türkiye are rated mostly successful or higher on development effectiveness.15 Advisory services projects in Latin America and the Caribbean lagged other regions, with 47 percent of projects rated mostly successful or higher in 2019–21 (appendix E, figure E.12).
Development effectiveness ratings of projects in FCS continue to improve. Eighteen of 32 projects (56 percent) evaluated in 2019–21 are rated mostly successful or higher on their development effectiveness, a stark contrast to the 22 percent success rate in 2015–17 (figure 3.8). The recent result suggests that some of the factors that IEG has previously identified as positively affecting development effectiveness have a larger effect on the FCS projects cohort. Past RAPs have reported the factors that negatively affect development effectiveness, such as large project size, longer project durations, and high team leadership turnover. Lack of client engagement or ownership, poorly executed M&E framework, and weak supervision practices were also important contributors to the decline in development effectiveness ratings. These drivers of low success ratings reversed in the last five years, notably the improvement in IFC work quality ratings since 2016. Actions taken in response to the IEG-IFC joint study on the work quality ratings of IFC advisory services projects indicate positive effects on development effectiveness ratings,16 including during the most recent period, 2019–21. The shorter duration and smaller size of recently approved advisory services projects also reduced the chance that exogenous shocks resulting from conflict will affect the projects’ development effectiveness, although this also applies to projects in non-FCS. Additionally, a recent IEG evaluation (The International Finance Corporation’s and Multilateral Investment Guarantee Agency’s Support for Private Investment in Fragile and Conflict-Affected Situations, Fiscal Years 2010–21; World Bank 2022b) found that locating IFC advisory services team leaders in the field may have reduced the frequent turnover among team leaders. Frequent team leader turnover, especially in complex projects, has negatively affected the development effectiveness of advisory services projects.
Development effectiveness ratings of projects in IDA countries outperformed projects in non-IDA countries. Sixty-five percent of evaluated projects in IDA countries in 2019–21 received mostly successful or higher ratings on their development effectiveness—a significant improvement from the 38 percent of projects rated mostly successful or higher in 2015–17 (figure 3.9). Success rates in non-IDA countries in 2019–21 are lower (56 percent) but have improved slightly compared with the 51 percent and 52 percent success rates in the 2017–19 and 2018–20 periods, respectively.
Development effectiveness and IFC role and contribution ratings are also strongly correlated. Projects with satisfactory or higher ratings on IFC role and contribution also have high ratings on development effectiveness. In 2012–21, 54 percent of projects with satisfactory or higher ratings on IFC role and contribution were also rated highly on their development effectiveness. However, there is only a 1 percent chance of receiving a high development effectiveness rating if IFC role and contribution is rated low. The association is more evident for advisory services projects rated at the opposite ends of the development effectiveness and IFC role and contribution rating scales. Half of the projects with low ratings on IFC role and contribution were also rated low on development effectiveness (appendix E, figure E.20).
Figure 3.8. Development Effectiveness Ratings of Projects in FCS and Non-FCS, 2012–21

Figure 3.8. Development Effectiveness Ratings of Projects in FCS and Non-FCS, 2012–21
Source: Independent Evaluation Group data.
Note: FCS = fragile and conflict-affected situations; MS+ = mostly successful or higher. Of the 573 self-evaluated and validated International Finance Corporation advisory services projects in fiscal years 2012 to 2021, 88 are in FCS, and 485 are in non-FCS. Forty of the 88 projects are rated mostly successful or higher on development effectiveness.
Figure 3.9. Development Effectiveness Ratings of Projects in IDA and Non-IDA Countries, 2012–21

Figure 3.9. Development Effectiveness Ratings of Projects in IDA and Non-IDA Countries, 2012–21
Source: Independent Evaluation Group data.
Note: Of the 573 advisory services projects that were self-evaluated and validated advisory in fiscal years 2012–21, 350 are in IDA countries, and 223 are in non-IDA countries; 127 of the 350 projects are rated MS+. IDA = International Development Association; MS+ = mostly successful or higher.
A high rating in IFC work quality increases the likelihood of a successful development effectiveness rating. IFC’s improved work quality and monitoring of development results were important factors in the improvement of development effectiveness ratings (World Bank 2021b). Forty-three percent of projects rated satisfactory or higher on IFC work quality are also rated mostly successful or higher on development effectiveness. The association is more evident in projects with ratings at the two extreme ends of the rating scale (that is, highly successful and highly unsuccessful). Sixty-nine percent of advisory services projects with unsatisfactory ratings on IFC work quality are also rated highly unsuccessful on development effectiveness. Crucially, there is zero chance of getting a highly successful rating on development effectiveness if IFC work quality is rated unsatisfactory, and vice versa (appendix E, figure E.18).
Development effectiveness and IFC role and contribution ratings are also strongly correlated. Projects with satisfactory or higher ratings on IFC role and contribution also have high ratings on development effectiveness. In 2012–21, 54 percent of projects with satisfactory or higher ratings on IFC role and contribution were also rated highly on their development effectiveness. However, there is only a 1 percent chance of receiving a high development effectiveness rating if IFC role and contribution is rated low. The association is more evident for advisory services projects rated at the opposite ends of the development effectiveness and IFC role and contribution rating scales. Half of the projects with low ratings on IFC role and contribution were also rated low on development effectiveness (appendix E, figure E.20).
Multilateral Investment Guarantee Agency
Development outcome ratings of recently evaluated MIGA guarantee projects showed considerable improvement. Including the two projects that were self-evaluated by MIGA and validated by IEG in the FY21 Project Evaluation Report (PER) program,17 70 percent of evaluated projects in FY16–21 are rated satisfactory or better, compared with 66 percent in FY15–20, 68 percent in FY14–19, and MIGA’s previous high development outcome rating of 69 percent in FY13–18.18 Disaggregated ratings on development outcome in figure 3.10 illustrate the stability of the ratings based on a six-year rolling average. On a year-on-year basis, however, evaluated projects in 2018, 2019, and 2020 show an increase in the share of projects rated unsatisfactory (from 6 percent in 2018 to 8 percent and 18 percent in 2019 and 2020, respectively). The share of projects rated satisfactory and partly unsatisfactory also declined during these three years (2018, 2019, and 2020). In 2021, the two self-evaluated and validated projects in the FY21 PER program were both rated successful. With the small number of MIGA evaluated projects, ratings from one project can make a big difference in the success rates.
Figure 3.10. MIGA’s Average and Disaggregated Development Outcome Ratings, 2012–21

Figure 3.10. MIGA’s Average and Disaggregated Development Outcome Ratings, 2012–21
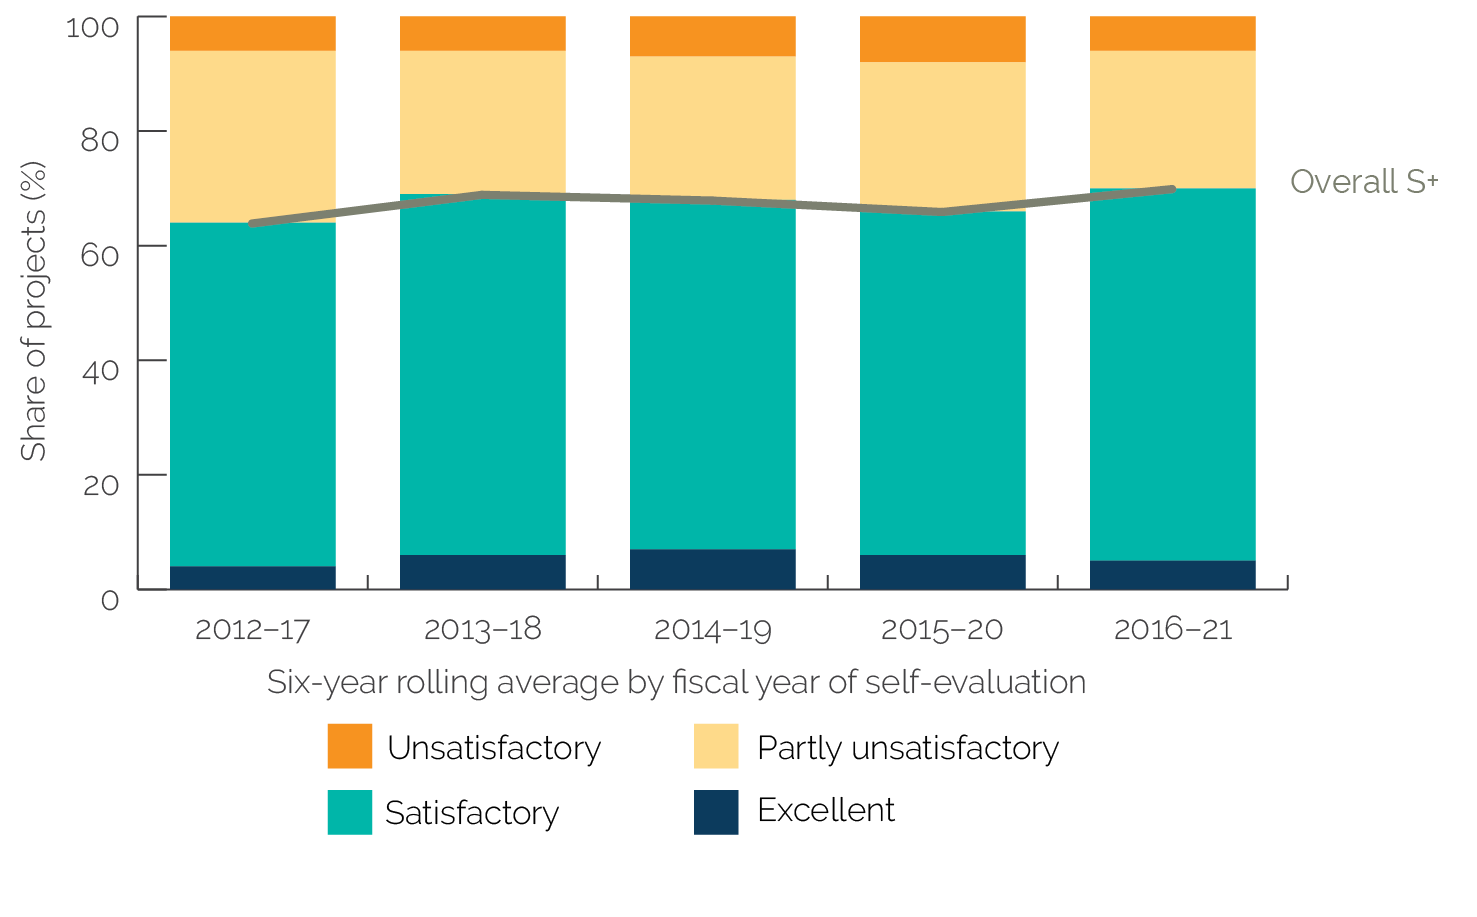
Source: Independent Evaluation Group data.
Note: Based on 108 projects evaluated in fiscal year (FY)12–21, of which 5 projects were rated excellent and 8 projects were rated unsatisfactory. Starting in FY20, MIGA projects are rated on development outcome on a six-point rating scale (a change from the previous four-point rating scale). There are only 2 of 8 projects that were self-evaluated and validated in the FY21 MIGA Project Evaluation Report program included in this report. FY = fiscal year; MIGA = Multilateral Investment Guarantee Agency; S+ = satisfactory or better.
MIGA projects rated at the extreme ends of the development outcome rating scale are few, with some distinguishing features, though they are not generalizable to the entire portfolio. The 13 projects with either excellent or unsatisfactory development outcome ratings are in similar sectors and Regions, but these two sets of projects have a few distinguishing features. Among projects rated highly on development outcome, early and consistent engagement with the guarantee holder throughout the life of the MIGA guarantee ensures buy-in and collaboration, especially on E&S aspects of the project. In three of five projects with excellent development outcome ratings, MIGA collaborated with other development finance institutions to enhance capacity building and promote corporate, industry, and transparency good practices. Information and knowledge sharing with other partners, including within the Bank Group, proved helpful in building E&S capacity and in promoting private sector development, especially in transition economies. Lessons from 8 projects rated unsatisfactory on development outcome included the importance of ascertaining at appraisal the guarantee holder and project enterprise buy-in on every aspect of the project and throughout the effectiveness period of the MIGA guarantee. Early engagement and buy-in are especially important for complex projects such as those in the oil and gas subsectors and projects in countries with governance challenges. A lesson from another project rated unsatisfactory on development outcome notes the importance during appraisal of ensuring that complex projects are supported by an engineering, procurement, and construction company that knows how to implement MIGA’s E&S requirements. Engaging knowledgeable independent engineers or external experts can also help mitigate E&S and operational risks, a lesson from another project rated unsatisfactory on development outcome. All 8 projects rated unsatisfactory also have poor business performance because of the sponsor’s inexperience, limited financial resources to meet business and operational challenges, overoptimistic assumptions, or, in one financial sector project, dependence on the parent company for financial support because of asset quality issues. A common takeaway from these 8 projects is the importance of assessing at appraisal the risks that are likely to affect development outcomes from the aforementioned lessons.
Development outcome ratings of projects in FCS and IDA countries also held steady, although the recent trend indicates a slight drop in IDA ratings. Of the 14 rated projects in FCS that were self-evaluated and validated between 2012 and 2021, 10 (71 percent) were rated satisfactory or better on development outcome. In the same period, 27 of the 42 (64 percent) self-evaluated and validated MIGA projects in IDA countries were rated high on development outcomes. In relation to the six-year average trend, there has been a slight decline in development outcome ratings among projects in IDA countries in the most recent period, 2016–21 (figure 3.11).
Figure 3.11. Development Outcome Ratings of MIGA Projects in FCS and Non-FCS and IDA and Non-IDA Countries, 2012–21

Figure 3.11. Development Outcome Ratings of MIGA Projects in FCS and Non-FCS and IDA and Non-IDA Countries, 2012–21
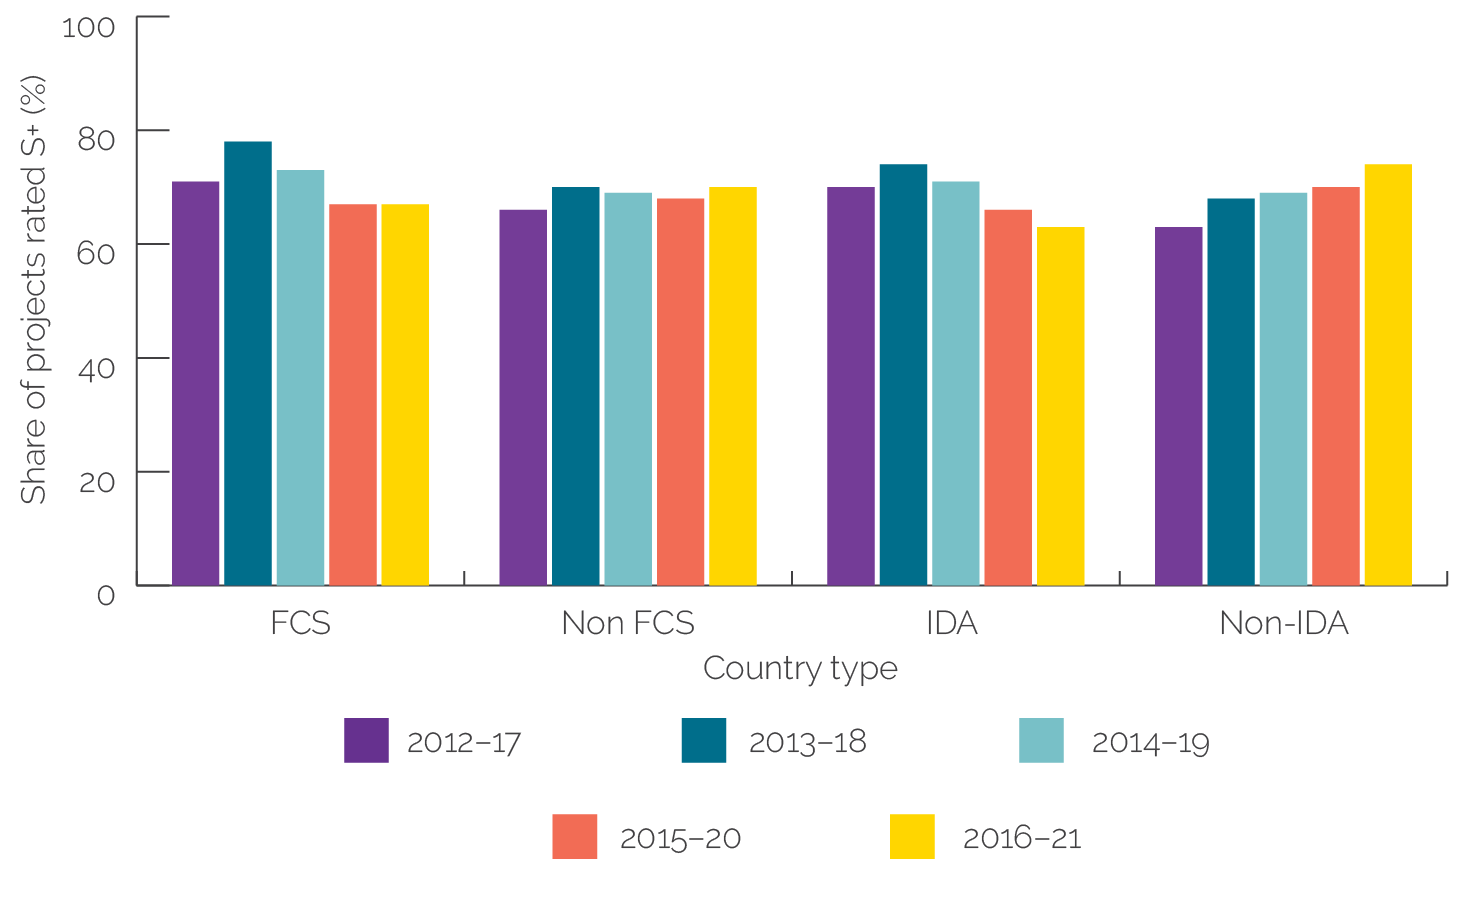
Source: Independent Evaluation Group data.
Note: Of the 108 evaluated MIGA projects in fiscal years 2012–20, 14 rated projects are in FCS and 42 are in IDA countries. Classification of projects by IDA and FCS used the World Bank Group List of Economies and Harmonized List of Fragile and Conflict-Affected Situations at the time of the MIGA contract effectiveness date. FCS = fragile and conflict-affected situations; IDA = International Development Association; MIGA = Multilateral Investment Guarantee Agency; S+ = satisfactory or better.
Development outcome ratings of projects in East Asia and the Pacific improved considerably in 2016–21 compared with 2015–20. In 2016–21, three of four evaluated projects in East Asia and the Pacific were rated satisfactory or better. Development outcome success rates of projects in Europe and Central Asia, Latin America and the Caribbean, and Africa held steady during the 2015–20 and 2016–21 periods. There were two evaluated projects in South Asia in 2012–20, and both have satisfactory or better ratings. Development outcome success ratings of projects in the Middle East and North Africa declined in 2016–21 from 2015–20, although the success rate is on par with the 75 percent satisfactory or better development outcome ratings of projects in East Asia and the Pacific in 2016–21. Six of eight (75 percent) evaluated projects in the Middle East and North Africa were also rated satisfactory or better on development outcome during the same period.
Finance and Capital Markets projects have made substantial gains in their development outcome ratings, from 58 percent in 2015–20 to 71 percent satisfactory or better ratings in 2016–21. Similarly, development outcome ratings of Agriculture, Manufacturing and General Services projects also showed considerable improvement in 2016–21 with the addition of 1 self-evaluated and validated project in 2021. Although the Energy and Extractive Industries sector has outperformed other MIGA sectors in previous years, its development outcome ratings have declined recently. Energy and Extractive Industries projects had higher average development outcome ratings than other sectors until 2014–19, when they declined to 80 percent from 86 percent in 2013–18 and subsequently to 67 percent in 2015–20 and 60 percent in 2016–21. Six of 10 self-evaluated and validated Energy and Extractive Industries projects in 2016–21 are rated satisfactory or better on development outcomes, compared with 8 of 12 projects in 2015–20. Recent 2016–21 development outcome results indicate that Infrastructure sector projects have a slightly higher share of satisfactory or better development outcome ratings (73 percent) than projects in other sectors (appendix E, figure E.22).
Development outcome is closely associated with MIGA’s role and contribution but less so with MIGA’s work quality. Satisfactory or higher ratings on MIGA’s role and contribution outpace the ratings on development outcome and the quality of MIGA’s assessment, underwriting, and monitoring (figure 3.12). Trends in these three dimensions have held steady in earlier years until 2014–19. In 2016–21, MIGA’s role and contribution ratings increased further to 88 percent from 84 percent in 2015–20, with the addition of two projects in 2021 that have satisfactory or higher ratings. High ratings on MIGA’s role and contribution are due to satisfactory or higher ratings in providing political risk mitigation (which enables provision of long-term financing and, in some cases, local currency financing when financing is not available from domestic or international financing sources), mobilizing finance, and increasing foreign direct investment flows. MIGA’s role and contribution also received high ratings for building capacity on E&S and improving corporate governance. Nearly all the 13 projects rated excellent on MIGA’s role and contribution got high marks for two contributions, which relates mostly to MIGA’s political risk mitigation role and improving projects’ E&S effects.
Nine of 10 recently evaluated projects were rated satisfactory on MIGA’s role and contribution in improving E&S aspects of the projects. MIGA’s role and contribution in improving the projects’ E&S aspects (self-evaluated and validated between 2017 and 2021) began at the due diligence stage by working with the MIGA guarantee holder and project enterprise in developing the Environmental and Social Action Plan. During project implementation, MIGA provided support and feedback to the guarantee holder and project enterprise through its review of annual monitoring reports, periodic site visits, and preparation of back-to-office reports. One example is MIGA’s involvement in a financial intermediary project that helped the bank’s subsidiaries develop E&S policies and procedures. MIGA also assisted in establishing the bank’s Environmental and Social Management System. By contrast, the only project rated partly unsatisfactory on MIGA’s role and contribution in E&S indicated that MIGA’s role and contribution would have been more substantial if the occupational health safety risks had been adequately identified at due diligence and if proper actions had been included in the Environmental and Social Action Plan and in the contract of guarantee between MIGA and the guarantee holder.
Figure 3.12. Development Outcome, Multilateral Investment Guarantee Agency’s Role and Contribution, and Work Quality Ratings, 2012–21

Figure 3.12. Development Outcome, Multilateral Investment Guarantee Agency’s Role and Contribution, and Work Quality Ratings, 2012–21
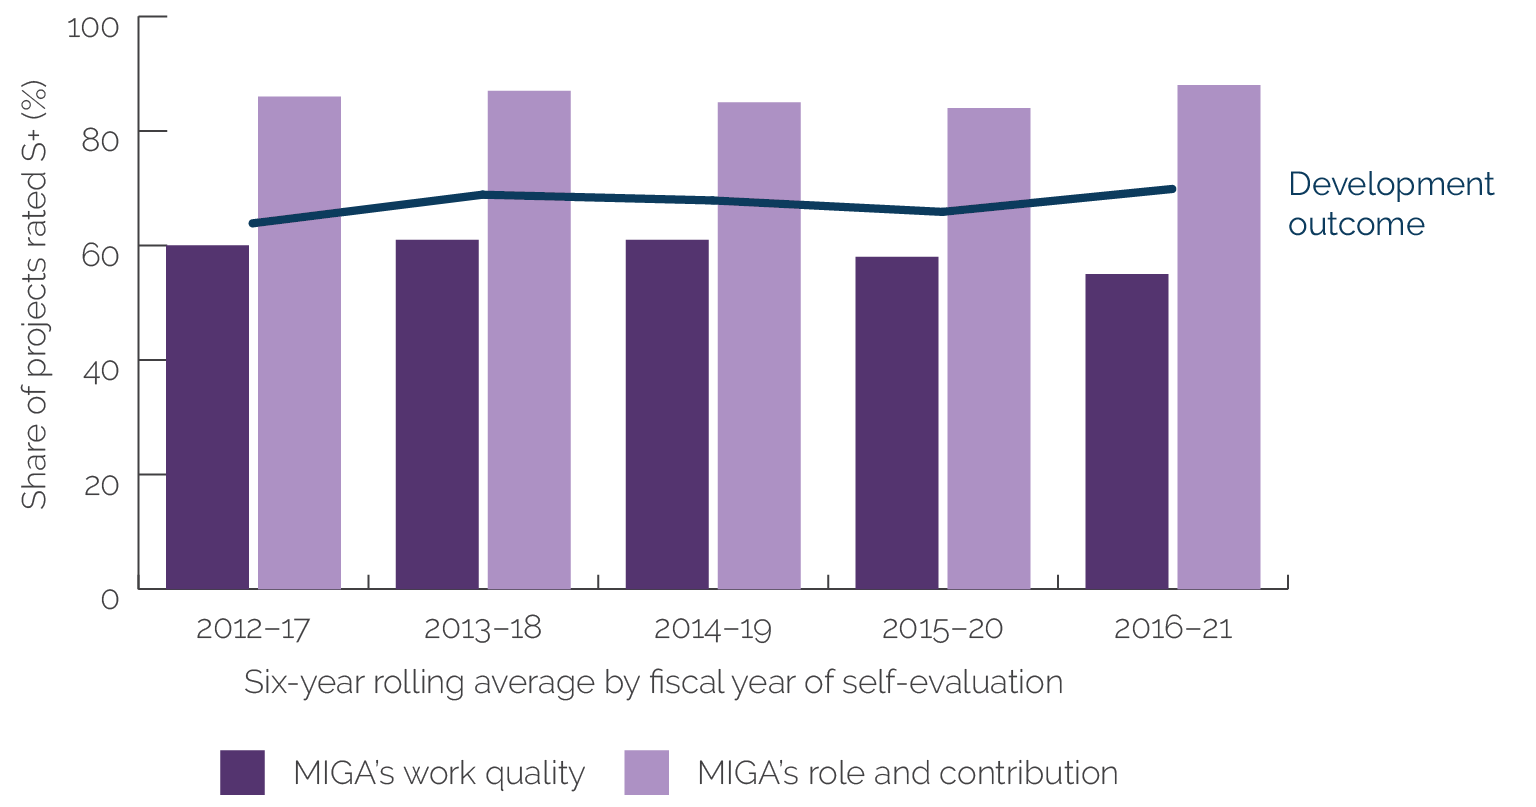
Source: Independent Evaluation Group data.
Note: MIGA = Multilateral Investment Guarantee Agency; S+ = satisfactory or better rating.
In 3 of the 10 projects, MIGA and IFC collaborated in joint investment projects where IFC led the projects’ due diligence and supervision activities. Although MIGA’s role and contribution in E&S were somewhat limited in these joint investments, MIGA continued contributing through its annual monitoring reviews and site visits to ensure that the project enterprise and guarantee holder complied with the E&S conditions of MIGA’s longer-term contract of guarantee conditions, even after the IFC loans are repaid.
- As of July 7, 2022, 809 Expanded Project Supervision Reports were completed (with completed Validation Notes from IEG). One project has a rating of no opinion possible in development outcome and was excluded from the totals.
- Small-size investment projects refer to investments with IFC total net commitment equal to or less than $4.3 million. Medium-size investment projects have IFC net commitment greater than $4.35 million and up to $35.74 million. Large-size investment projects have IFC net commitment greater than $35.74 million.
- Historical performance of IFC investment projects indicates that equity-only investments and greenfield investments tend to have lower development outcome ratings than projects involving expansion or modernization (also known as brownfield) because such projects tend to be riskier.
- Five projects have a rating of no opinion possible on IFC’s investment outcome.
- In 2019–21, 33 of the 48 evaluated investment projects in Africa had an unsuccessful or lower rating on development outcome. Fifteen projects were in the Manufacturing, Agribusiness, and Services industry group; 13 were projects by the Financial Institutions Group; and 5 were from Infrastructure and Natural Resources. Seven of the less successful Manufacturing, Agribusiness, and Services projects are in health, education, and life sciences, projects to which IFC provided equity investment.
- For an analysis of IFC’s Risk-Sharing Facility, see World Bank (2022a), box 2.2.
- Development outcome ratings of equity projects in International Development Association countries outside of the Africa Region have improved substantially, from 33 percent in 2015–17 to 75 percent in 2018–20. In the same period, equity investments in International Development Association countries in Africa remained flat, moving from 14 percent to just 17 percent in the same period.
- The result for the Central Asia and Türkiye region may not be statistically significant because of the few projects evaluated in 2019–21 (only 9). Between 2012 and 2021, there were only 47 evaluated investment projects in Central Asia and Türkiye.
- Fifty-six of the 809 investment projects evaluated in calendar years 2012–21 are in FCS, and 753 projects in non-FCS. In 2019, 6 FCS projects were evaluated, and 2 projects were rated mostly successful or higher on development outcome. In 2020, of the 9 evaluated projects in FCS, 1 project was rated mostly successful or higher on development outcome. In 2021, of the 4 evaluated projects in FCS, 1 project was rated mostly successful or higher on development outcome.
- Measurement and rating of IFC’s additionality began in 2015. Before this calendar year, the indicator of IFC’s role and contribution was used. IFC’s additionality is a broader concept than role and contribution.
- IFC’s additionality is a subset of its role that is unique to IFC and that cannot be filled by the client or any commercial financier. IFC’s additionality in a project consists of two types: financial and nonfinancial additionality. IFC’s additionality in its investment projects is rated based on four criteria: excellent, satisfactory, partly unsatisfactory, or unsatisfactory.
- Thirty percent of evaluated projects in FCS in 2012–20 (42 of 139 ex post additionalities) identified the presence of IFC’s support in the financial structuring of the investment as IFC’s financial additionality or contribution to the sponsor. Regarding nonfinancial IFC’s additionality, the introduction of new and better standards was identified as the most present among evaluated projects in FCS (31 of the 139 ex post additionalities, or 22 percent). The pattern is also similar for evaluated projects in non-FCS, where 60 percent of projects have received both financial and nonfinancial additionality from IFC. Financial structuring of the project is the most present IFC financial additionality in projects in non-FCS (32 percent), and the new and better standards were prevalent among IFC’s nonfinancial additionality (23 percent). An ongoing IEG evaluation of IFC’s additionality in middle-income countries, due in FY23, can provide greater and deeper insights about IFC’s additionality.
- The assessment of the IFC’s investment outcome at the project level considers the qualitative observations of the performance of each investment associated with the project and data from IFC’s resource management system to gauge the likely contribution after considering costs. If IFC made only a loan or only an equity investment in support of the evaluated project, then the overall investment outcome rating is the same as that for the loan or equity indicator, as applicable. However, if IFC made both loan and equity investments in support of the evaluated project, they are rated separately, and IFC’s investment outcome is rated on a four-point scale: excellent, satisfactory, partly unsatisfactory, and unsatisfactory.
- A total of 185 IFC advisory services projects were selected for evaluation in FY19, FY20, and FY21. All 54 projects selected for evaluation in 2019 and 68 projects selected for 2020 were completed as of June 30, 2022. Of the 63 advisory services projects selected for evaluation in FY21, 32 were completed (52 percent) as of June 30, 2022.
- Afghanistan and Pakistan are grouped with Middle East region in IFC’s regional classification as of September 2021.
- The IEG-IFC joint study on the link between IFC advisory services projects’ work quality and development outcome found that weakness in project design and the monitoring and evaluation (M&E) framework in the evaluated IFC advisory services projects were the main shortcomings across all sectors. Project design was the most frequent driver of low development effectiveness ratings.
- There are 8 projects in MIGA’s FY21 Project Evaluation Report program. Of these, 2 were self-evaluated and validated as of the RAP 2022 cut-off date of June 30, 2022. Another 2 self-evaluated projects were submitted to IEG for validation on June 30, 2022, too late to be included in the RAP 2022. The self-evaluations of the 4 remaining projects in the FY21 Project Evaluation Report program have not been submitted to IEG for validation as of the end of August 2022.
- See Results and Performance of the World Bank Group 2021 (World Bank 2021b), which describes initiatives by MIGA to enhance its self-evaluation. In addition, MIGA’s ability to collect information and track development results is inherently limited by its role as a guarantee provider, with an indirect relationship with the project enterprise through the guarantee holder. It has sought to overcome these challenges, including by having teams (prior to the COVID-19) visit nearly all projects that are subject to self-evaluation. Over the years, MIGA has made efforts to undertake self-evaluations of all guarantee projects—including canceled guarantees—which are then validated by IEG. MIGA has also been deferring evaluations for projects that are not yet fully operational and projects with political risks until those issues are resolved and its criteria for determining which projects are eligible for evaluation are more firm.