Making Procurement Work Better
Chapter 2 | Improving Procurement Efficiency
Highlights
The 2016 reform helped speed up procurement to a median turnaround time of about two months by simplifying the review processes and using simple procurement approaches, where appropriate, and hands-on assistance in low-capacity countries.
Procurements with high risks, high values, competitive approaches, technical complexity, and innovative solutions have longer turnaround times than simpler procurements. The World Bank could take steps to simplify these types of procurements.
The late start of procurement after project approval, lack of client procurement experience, and procurement processing issues—especially when preparing technical documents and evaluating bids for competitive processes—undermine procurement efficiency and delay lending disbursements. About 45 percent of projects in Western and Central Africa encounter a high number of processing issues. About half of projects sign their first procurement at the end of the first year, delaying project benefits.
The World Bank’s new electronic tracking system—Systematic Tracking of Exchanges in Procurement—increases the efficiency of document reviews, but clients do not consider it user-friendly.
High-capacity clients do not require as much support from World Bank staff during procurement reviews. In lower-capacity contexts, however, client learning could be a trade-off for faster procurement and client empowerment. Clients often value the support of the World Bank procurement staff in longer prior reviews.
This chapter assesses the principle of procurement efficiency. Efficiency encompasses the speed and ease of handling procurement. The chapter looks at procurement timelines, the benefits of simplified procurement reviews and STEP, and procurement issues arising when processing a procurement activity and resulting in delays, unsound products, or a lower-quality process. Procurement processing in World Bank–supported projects has been faster since the reform, but it is disrupted by common procurement issues and the late start of a project’s procurement process. Moreover, larger and more complex procurement continues to be slower.
Faster Procurement since the Reform but with a Wide Array of Processing Times
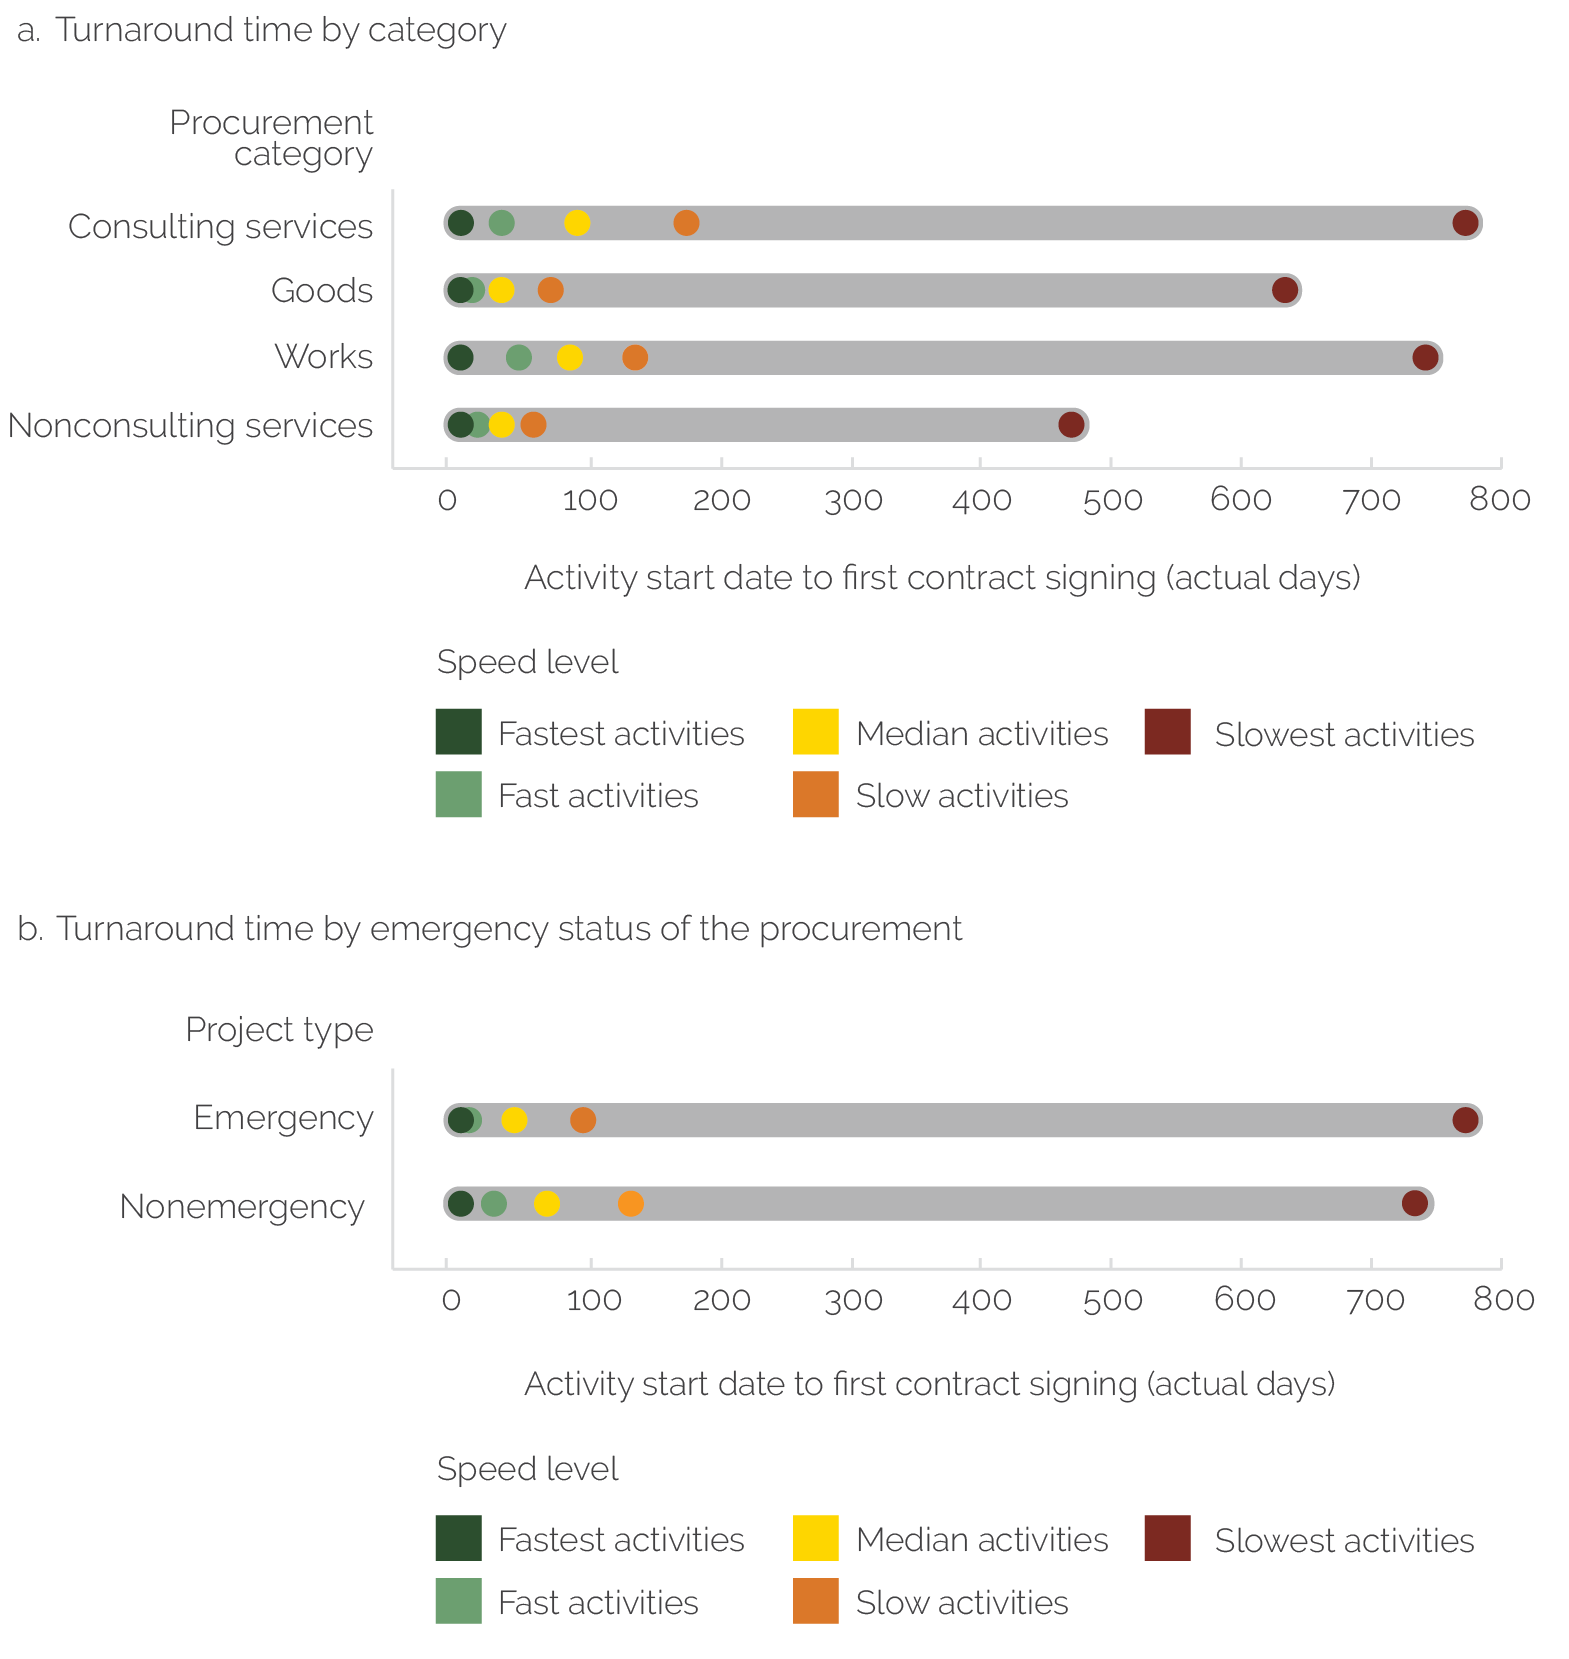
Procurement processing has quickened in World Bank–supported projects since the reform, but processing times for certain types of procurement remain long. The median turnaround time for procurement in World Bank–supported projects is 57 days, or about two months (69 days if procurement done in emergency projects is excluded; see appendix C).1 This shows good progress from 85 days in FY17 and is consistent with median findings from a report that reviewed the procurement reform after five years of implementation (World Bank 2022b). IEG’s 2014 procurement evaluation found a median turnaround time of 210 days in FY13, or about seven months (World Bank 2014).2 The faster procurement processing time holds across consulting services, goods, works, and nonconsulting services, although consulting services and works present the slowest times (figure 2.1, panel a). The average time for consulting services procurement before the reform was 290 days, which decreased to 140 days; the average time for goods procurement before the reform was 288 days, which decreased to 58 days; and the average time for works before the reform was 307 days, which decreased to 119 days (World Bank 2014).3 Although the urgency of the COVID-19 pandemic likely helped speed up procurement (World Bank 2022c), faster processing time also holds for procurement in both emergency and nonemergency projects (figure 2.1, panel b). The faster procurement processing speeds up project implementation because most project activities require procurement. However, figure 2.1 shows the continued challenge of the wide distribution of procurement processing times across projects. This wide range of procurement times is also consistently observed in case studies and is reported in the survey (appendixes F and G). The differences in efficiency of procurement across projects are not new and were reported in IEG’s 2014 procurement evaluation.
Faster procurement times in World Bank–supported projects are largely a result of the simplification of review processes. Specifically, the reform increased the threshold for which a client’s procurement activity requires a full review by World Bank staff before and throughout its implementation. As a result, World Bank teams carry out fewer prior reviews in favor of post reviews that review a sample of the client’s completed procurement activities to ensure integrity and compliance with the procurement framework. This saves time because it cuts down on the required exchanges between the client and World Bank staff at each stage of the prior review process. For example, about 20 percent of prior reviews identify processing issues that add to turnaround times, such as missing information and document revisions. Such issues are not checked up front in post reviews.
Figure 2.1. Turnaround Times for Procurement in Days by Category and Emergency Status

Source: Independent Evaluation Group.
Note: The figure shows projects’ turnaround time statistics, in which turnaround time is measured by the number of actual days from an activity’s start date to its first procurement contract signing date within different procurement category and review type combinations adjusted for outliers. Examples are the time between an activity’s start date and its first contract signing in prior review activities for consulting services or the time between the same activity’s start date and its first contract signing in post review activities for goods. Fastest activities = minimum turnaround time; fast activities = 25th percentile of turnaround time; median activities = median turnaround time; slow activities = 75th percentile of turnaround time; slowest activities = maximum turnaround time. Fastest activities have a turnaround time of zero days and account for under 10 percent of activities; of this 10 percent, 15 percent have the same activity start date and first contract signing date, whereas 85 percent have their first contract signing date occurring before the activity start date. In the latter case, turnaround time is converted to zero to avoid a negative turnaround time. Zero-day turnaround time was most frequent at the start of COVID-19. It accounts for (i) almost 24 percent of procurement activities of projects approved in fiscal year 2020, (ii) over 16 percent of human development procurement activities, and (iii) over 16 percent of procurement of goods. These shares are well above other Practice Groups (Equitable Growth, Finance, and Institutions follows with 6.5 percent) and procurement categories (nonconsulting services category follows with 6.8 percent). Emergency projects are defined as having at least one of the following: (i) a general emergency flag, (ii) a COVID-19 response pillar flag, or (iii) an investment project financing disaster response flag. The total number of activities in 614 projects with signed contracts is 25,352.
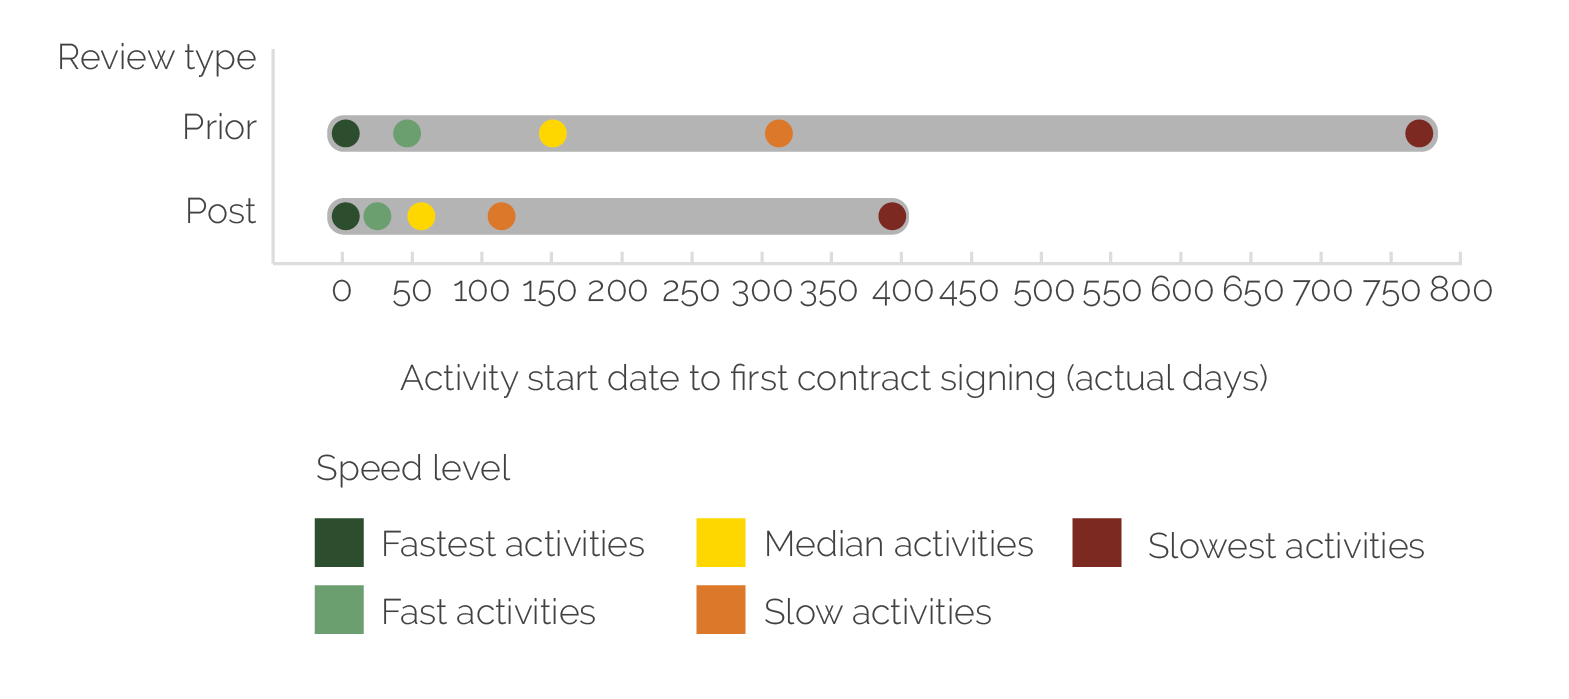
The simplified review process speeds up procurement by as much as twofold, with prior review procurement activities continuing to be slow (figure 2.2). Since the reform, procurement post reviews have been used for about 85 percent of the total number of procurement activities. About 65 percent of financing in projects uses post reviews compared with less than 50 percent of financing before the reform. The average time gained from using post reviews instead of prior reviews is about three months per procurement activity. In FY21 and FY22, World Bank procurement staff carried out prior reviews of about 800 contracts per year for procurement in the evaluation portfolio compared with over 8,500 contracts per year between FY00 and FY11 and 10,917 contracts in FY14 (World Bank 2014, 2022b). Procurement activities subject to prior review continue to be slow: the median processing timeline for prior review procurement after the reform is 152 days, closer to the 210-day median before the reform (World Bank 2014). This is similar to the timelines of other multinational development partners, such as the Asian Development Bank, which reports that procurement timelines for procurement activities subject to prior review remained about the same before and after their own reforms: 304 days in 2022 compared with 300 days in 2016 (ADB 2023).
Figure 2.2. Turnaround Times for Procurement in Days by Review Type

Source: Independent Evaluation Group.
Note: The figure shows projects’ turnaround time statistics, in which turnaround time is measured by the number of actual days from an activity’s start date to its first procurement contract signing date within different procurement category and review type combinations adjusted for outliers. Examples are the time between an activity’s start date and its first contract signing in prior review activities for consulting services or the time between the same activity’s start date and its first contract signing in post review activities for goods. Fastest activities = minimum turnaround time; fast activities = 25th percentile of turnaround time; median activities = median turnaround time; slow activities = 75th percentile of turnaround time; slowest activities = maximum turnaround time. Fastest activities have a turnaround time of zero days and account for under 10 percent of activities; of this 10 percent, 15 percent have the same activity start date and first contract signing date, whereas 85 percent have their first contract signing date occurring before the activity start date. In the latter case, turnaround time is converted to zero to avoid negative values. The total number of activities in 614 projects with signed contracts is 25,352.
Using simple approaches makes project procurement faster. Some procurement approaches, such as a request for quotation that accounts for about 30 percent of procurement activities, have quick timelines of about 35 days and are appropriate for certain types of low-risk project activities. Another approach, e-auction, accounts for less than 1 percent of the total number of procurement activities but offers a similar timeline advantage.4 Similarly, United Nations (UN) direct contracting that involves hiring a UN agency to conduct a service or procure goods, for example, speeds up procurement for human development and sustainable development projects, which account for about 90 percent of UN contracts. UN direct contracting takes on average about 60 days to process.
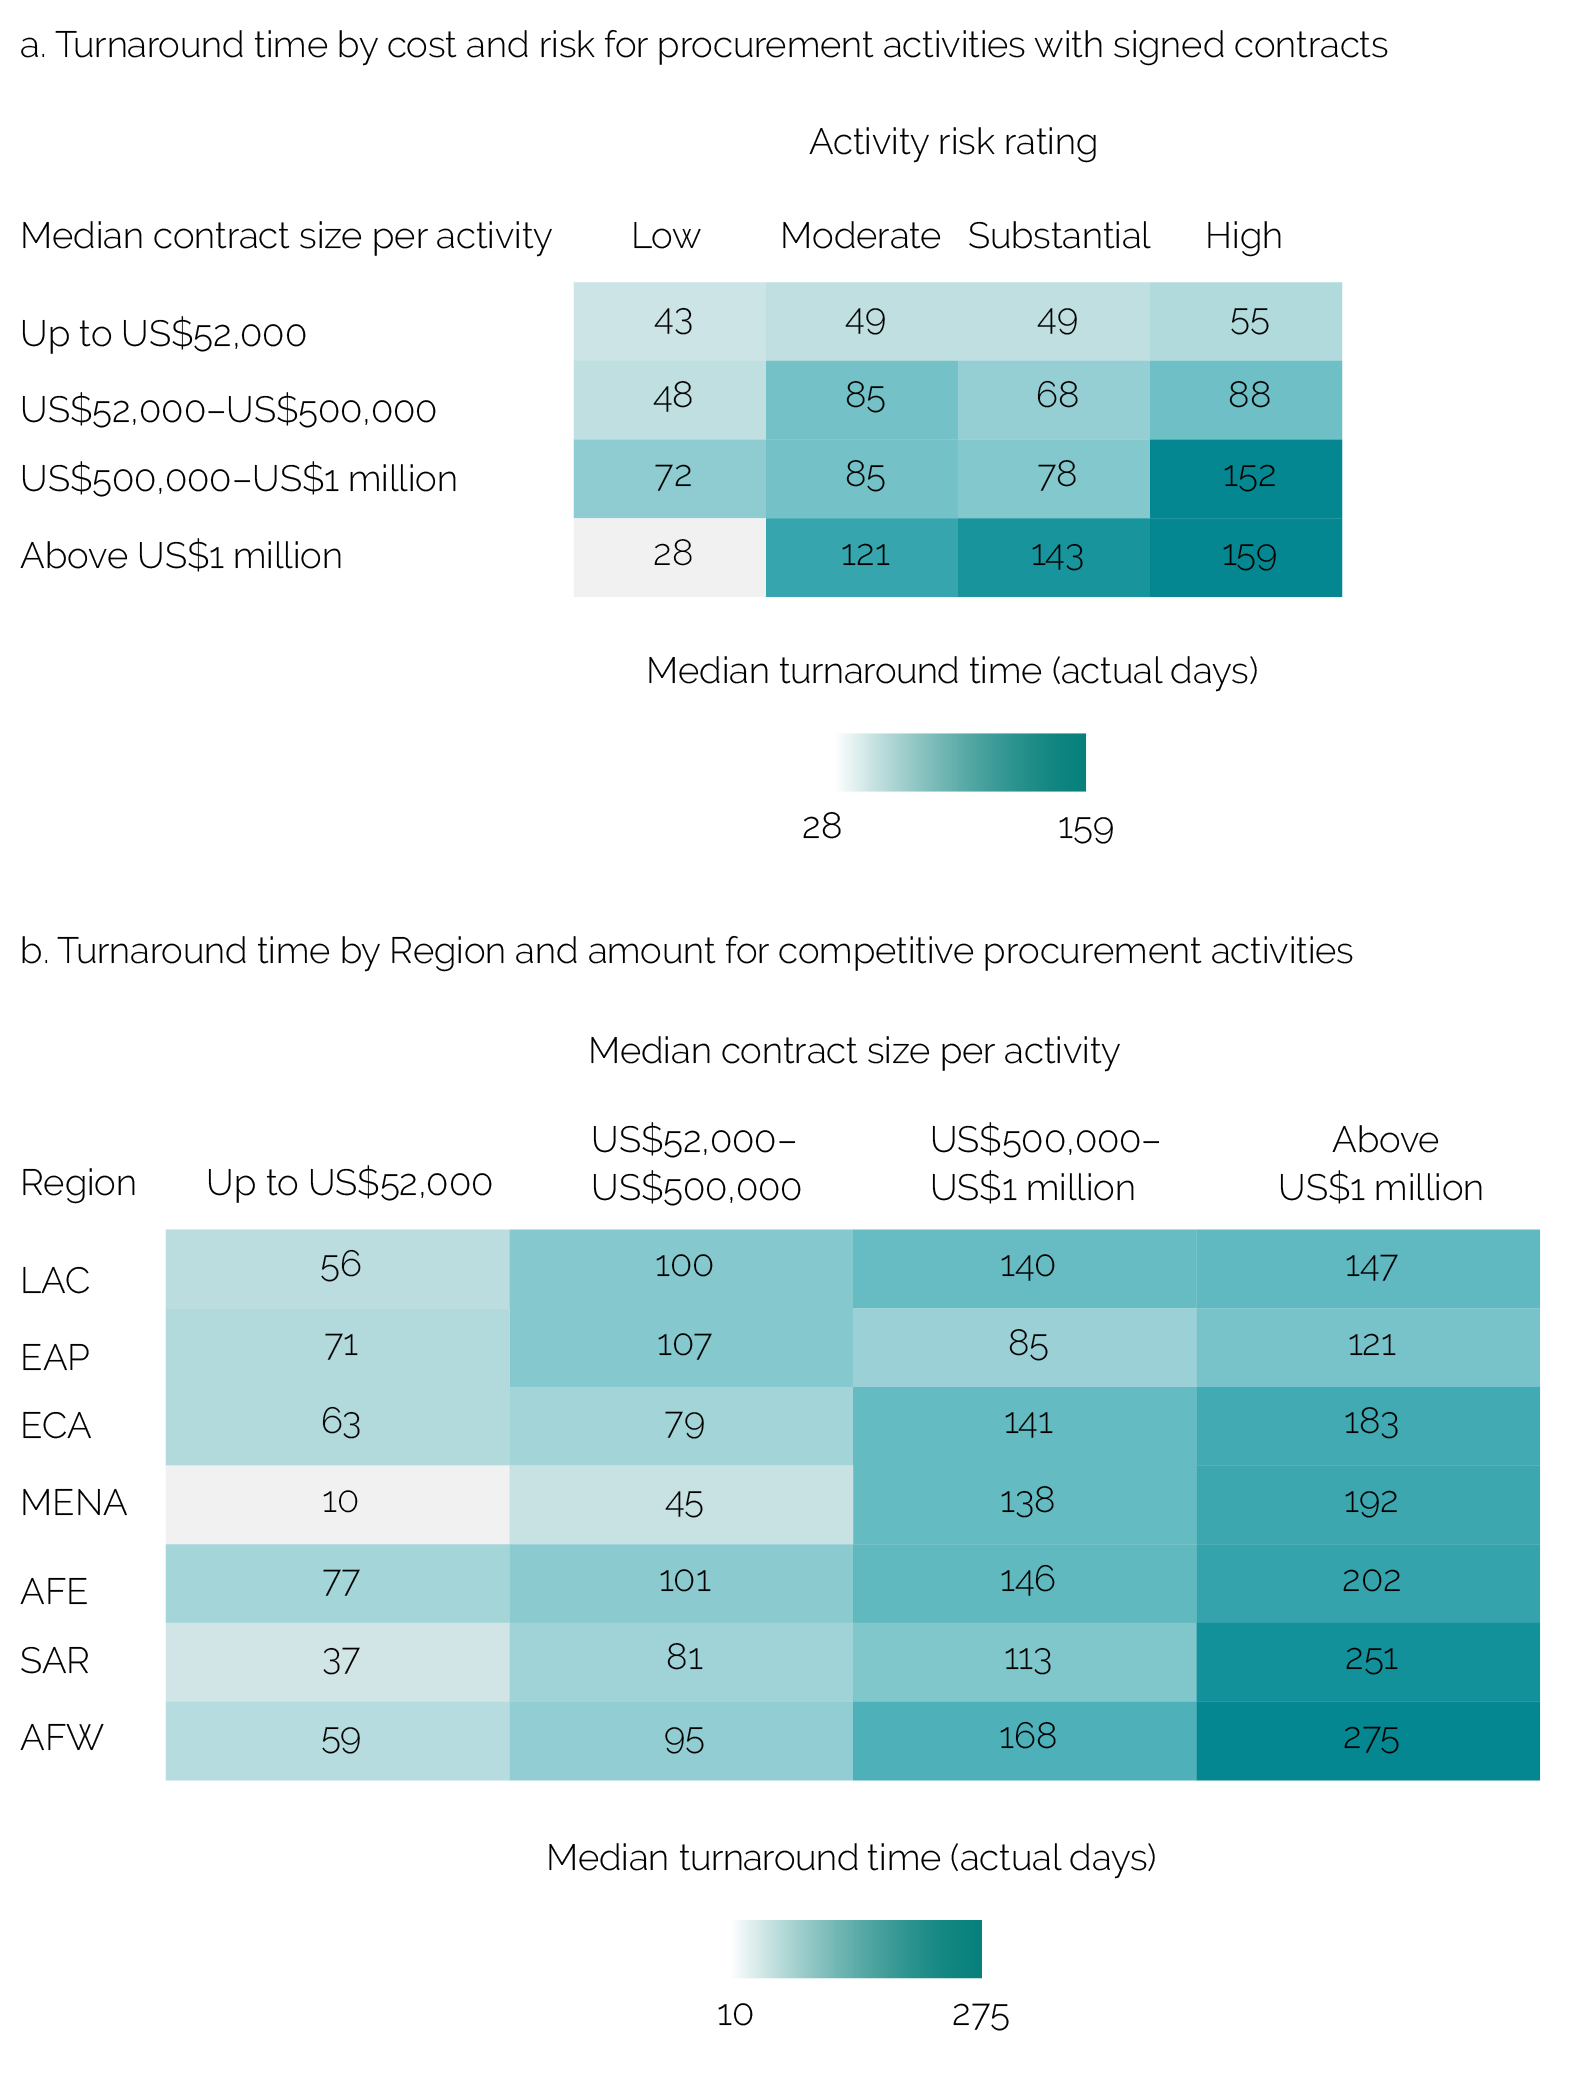
Procurement times are longer for high-cost, high-risk procurements with competitive contracting approaches; these longer timelines are expected but could be improved. Low-risk procurement activities are those that are not technically complex and have greater client capacity or fewer integrity, processing, and complexity risks.5 On average, procurement processing times are about 30 percent faster for lower-risk than higher-risk activities. Similarly, on average, procurement processing times are faster for lower-value procurement activities than for higher-value procurement activities. Procurement for activities under $52,000 lasts about 75 days (which gets progressively slower as activities’ monetary values increase). Figure 2.3, panel a, shows median procurement turnaround times by activity risk rating and cost, demonstrating that procurement activities with higher risk and cost continue to process slowly. The median is shown because the average is affected by the broad range of procurement times in the portfolio. Figure 2.3, panel b, shows by Region that procurement is slower when values are large and when it uses competitive approaches. Although having longer timelines for higher-risk, competitive, and larger procurement is expected, the World Bank could explore ways to simplify turnaround times for these procurements to support quicker delivery of activities in World Bank–supported projects. Competitive procurement activities are especially slow in Western and Central Africa and South Asia (discussed in chapter 3).
Figure 2.3. Turnaround Times for Procurement Activities by Cost, Risk, and Region

Source: Independent Evaluation Group Systematic Tracking of Exchanges in Procurement data analysis.
Note: The figure shows the median turnaround time per procurement activity. Turnaround time is defined as the time in days between the start date of the procurement activity entered in the system and its first contract signing date, adjusting for outliers. Competitive procurement includes limited and open market approaches, excluding direct procurement without competition. Panel a: The total number of procurement activities in 614 projects with signed contracts and available activity risk rating information is 25,344. Panel b: The total number of procurement competitive activities with signed contracts in 601 projects is 19,190. AFE = Eastern and Southern Africa; AFW = Western and Central Africa; EAP = East Asia and Pacific; ECA = Europe and Central Asia; LAC = Latin America and the Caribbean; MENA = Middle East and North Africa; SAR = South Asia.
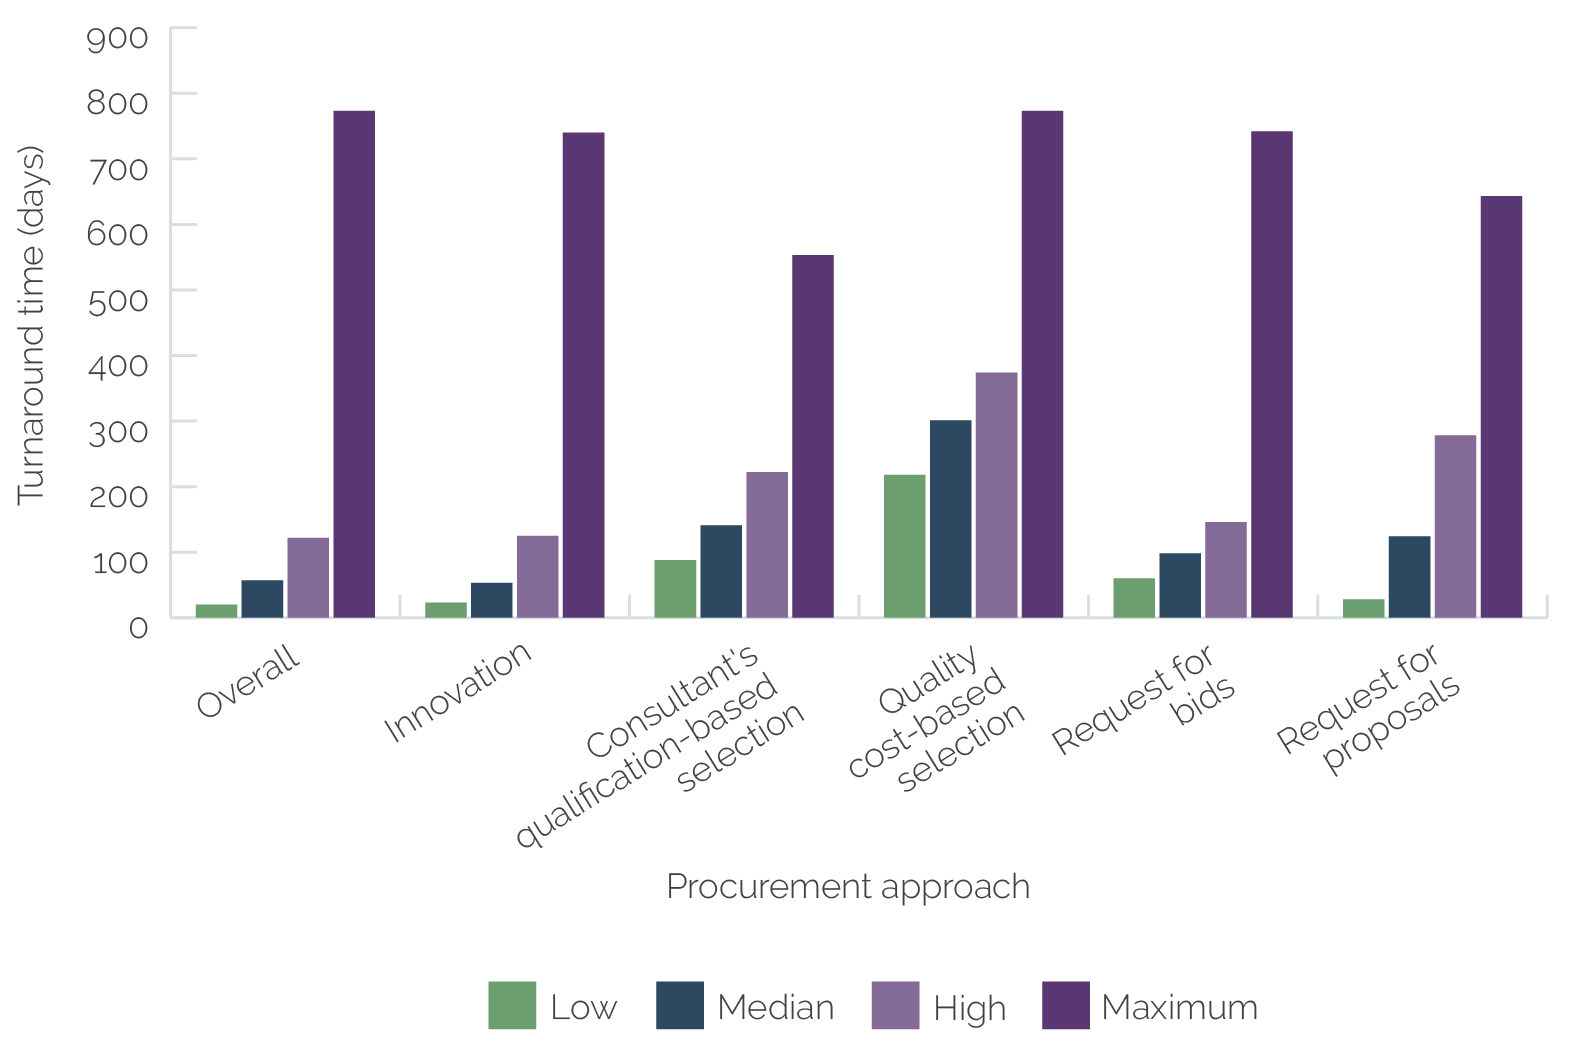
Procurement approaches that evaluate quality or are innovative also have longer timelines that are similar to timelines before the reform. Procurement activities using approaches that evaluate the quality of bids or consulting service proposals require additional steps. As such, these activities take additional time. Competitive approaches also require additional steps. For example, requests for bids or proposals include steps to advertise the procurement and bid and proposal evaluations (figure 2.4). Thus, processing a request for bids takes a median time of just over three months (98 days) but can take as long as 742 days (or about two years). Consultant quality cost-based selection takes a median time of 301 days but can take as long as 773 days. Innovative procurement approaches can take longer because the client must learn how to carry out the approach. Finding ways to ease the use of quality procurement approaches in World Bank–supported projects may be helpful—for example, by developing tools to help speed up the transparent identification of qualified bidders and bid evaluation (see chapter 3).
Figure 2.4. Turnaround Time for Complex Procurement Approaches

Source: Independent Evaluation Group Systematic Tracking of Exchanges in Procurement data analysis.
Note: The timeline considers the start date of the procurement activity entered in the system to the first contract signing date. Low is the quartile of activities that are the fastest in projects, and high is the quartile of activities that are the slowest in projects. Maximum is the maximum timeline in days in the portfolio, adjusting for outliers. The minimum timeline is zero days and is not shown. The analysis includes 12 innovative procurement features: alternative procurement arrangements, requests for proposals, rated criteria, best and final offer, negotiations, competitive dialogue, one-stage two-envelope bidding, e-auctions, service delivery contracts, public-private partnerships, performance-based conditions, and community-driven development. The total number of procurement activities in 614 projects with signed contracts is 25,352.
Technical complexity can increase procurement times for clients without experience in the area or support from the World Bank. This evaluation’s portfolio analysis shows that the longest procurement processing timelines are typically for procuring technically complex works, goods, or services. This includes the procurement of public utilities, electrical and power generation equipment, building construction and industrial materials, advanced technology, laboratory equipment, and engineering services. Some of these technically complex procurement activities have large values, and others are smaller-value activities. The turnaround time for procurement with high technical complexity ranges from 6 to 15 months, with some activities taking years. Examples from the case studies of technically complex and lengthy procurement activities include large works, such as roads and hospitals; consulting services for engineering designs and aerial photography; and goods for information technology systems and solar energy (appendix F). This finding that technically complex activities take longer to procure aligns with IEG’s evaluation on disruptive and transformative technologies that shows that procurement slows implementation of technology-related projects (World Bank 2021b). Case studies suggest that technically complex activities with small values could benefit from greater attention from procurement staff to speed them up. For example, community-driven development activities that are complex because they involve actors at different levels could benefit from more support.
Starting Procurement Late, Lack of Client Experience, and Processing Issues That Contribute to Delays
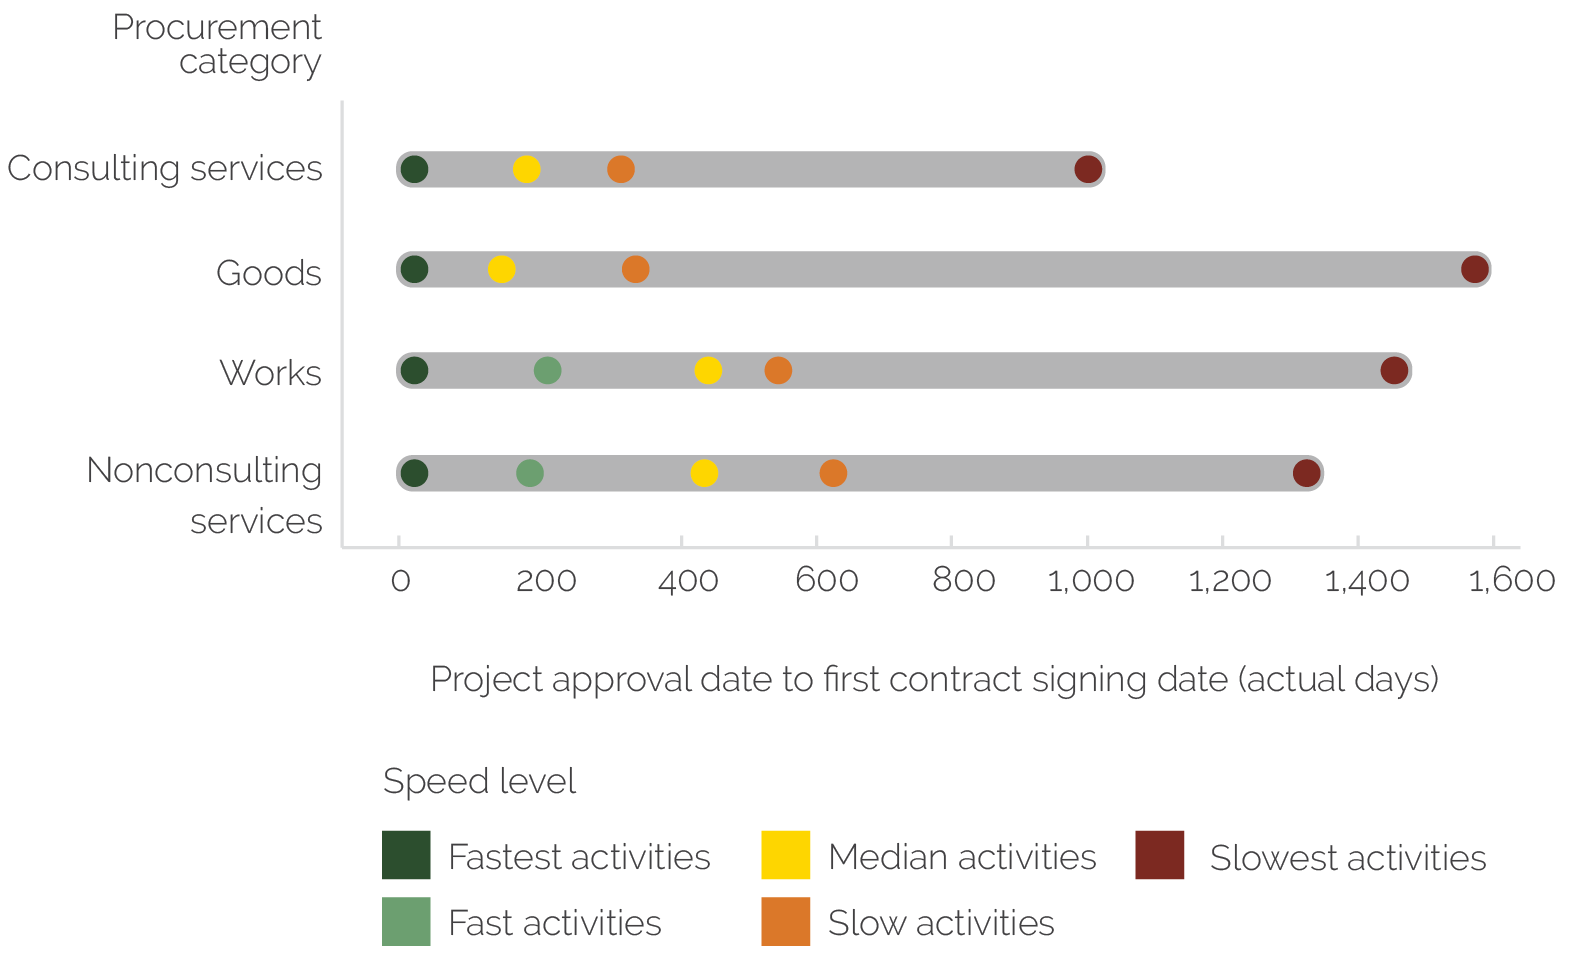
The late start of projects’ procurement activities—often because the client must recruit procurement specialists—delays project implementation. About half of projects from FY17 to FY23 signed their first contract toward the end of the first year of implementation, delaying the start of these projects’ implementation. The importance of improving the start time of the first procurement in the project is also demonstrated in the regression analysis that suggests that efficiency gains are diminished when procurement does not start early (appendix C). Similar timelines are seen across procurement categories for the first contract awarded in a project (figure 2.5). Across Practice Groups, the proportion of projects that sign their first contract late is also about half. By contrast, the Infrastructure Practice Group has more projects with early contract signings, allowing large procurement processes for works to start quickly. Similarly, the Human Development Practice Group tends to have early contract signings, likely because of its push to procure medical supplies quickly during COVID-19. The lack of available, experienced client procurement specialists to support a project frequently causes delays at the start of procurement. In some projects, recruiting the client’s procurement specialist took several years (appendix G).
Figure 2.5. Timelines of First Contract Signing in a Project by Procurement Category

Source: Independent Evaluation Group Systematic Tracking of Exchanges in Procurement data analysis.
Note: The figure shows projects’ first procurement speed statistics, with procurement speed measured by the number of actual days from a project’s approval date to its first procurement contract signing date within different procurement category and review type combinations adjusted for outliers—for example, the time between a project’s approval and its first contract signing in prior review activities for consulting services or the time between the same project’s approval and its first contract signing in post review activities for goods. Fastest activities = minimum turnaround time; fast activities = 25th percentile of turnaround time; median activities = median turnaround time; slow activities = 75th percentile of turnaround time; slowest activities = maximum turnaround time. Fastest activities have the first procurement processing time of zero days and account for under 26 percent of activities; of this 26 percent, less than 1 percent have the same project approval date and first contract signing date, whereas over 99 percent have their first contract signing date occurring before the project approval date. In the latter case, the first procurement processing time is converted to zero to avoid negative values. The number of activities in 612 projects with signed contracts is 26,573.
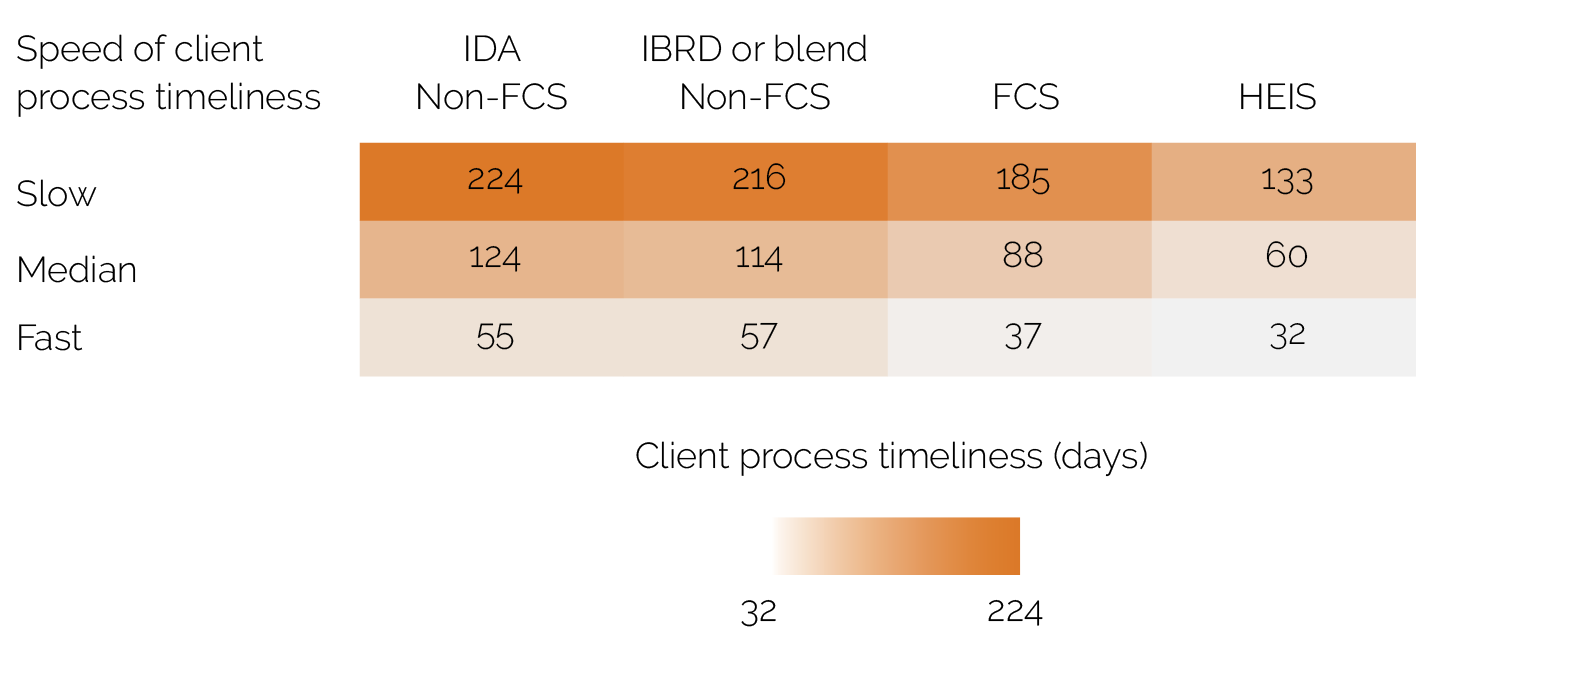
Projects with less experienced client procurement staff and limited support have longer procurement times. Case studies indicate that projects that find it difficult to hire experienced procurement specialists have longer processing times. Notably, processing times in FCS contexts are quicker than in other contexts (figure 2.6). This faster speed is the result of extensive coaching of clients by World Bank staff and external experts to help procurement in World Bank–supported projects in those countries. Case studies echo this finding and demonstrate that procurement processing times are being shortened across countries because of World Bank procurement staff support, including hands-on expanded implementation support (HEIS)—a tool the World Bank uses to support low-capacity clients. International Development Association (IDA) countries show consistently slower times for procurement than International Bank for Reconstruction and Development (IBRD) countries, and case studies indicate that one reason for this is the access to experienced client procurement staff in the project, although the country procurement context is also a factor. The literature also shows time differences for World Bank public works procurements across country types (Bosio and Djankov 2020), with countries that have greater political accountability and stronger economies processing public works procurement more quickly.
Figure 2.6. Client Process Timeliness for Prior Review Procurement Activities by Country Type

Source: Independent Evaluation Group Systematic Tracking of Exchanges in Procurement data analysis.
Note: Client process timeliness is defined as the sum of client–World Bank interaction timeliness for all interactions within a procurement activity. It is only defined for prior review activities and has available information for 2,972 of 7,163 activities (40 percent of prior review). Slow = 75th percentile cutoff value of the client process timeliness distribution within each column category; median = 50th percentile cutoff value of the client process timeliness distribution within each column category; fast = 25th percentile cutoff value of the client process timeliness distribution within each column category. The number of prior review activities with available information on client process timeliness in 496 projects is 2,972. FCS = fragile and conflict-affected situations; HEIS = hands-on expanded implementation support; IBRD = International Bank for Reconstruction and Development; IDA = International Development Association.
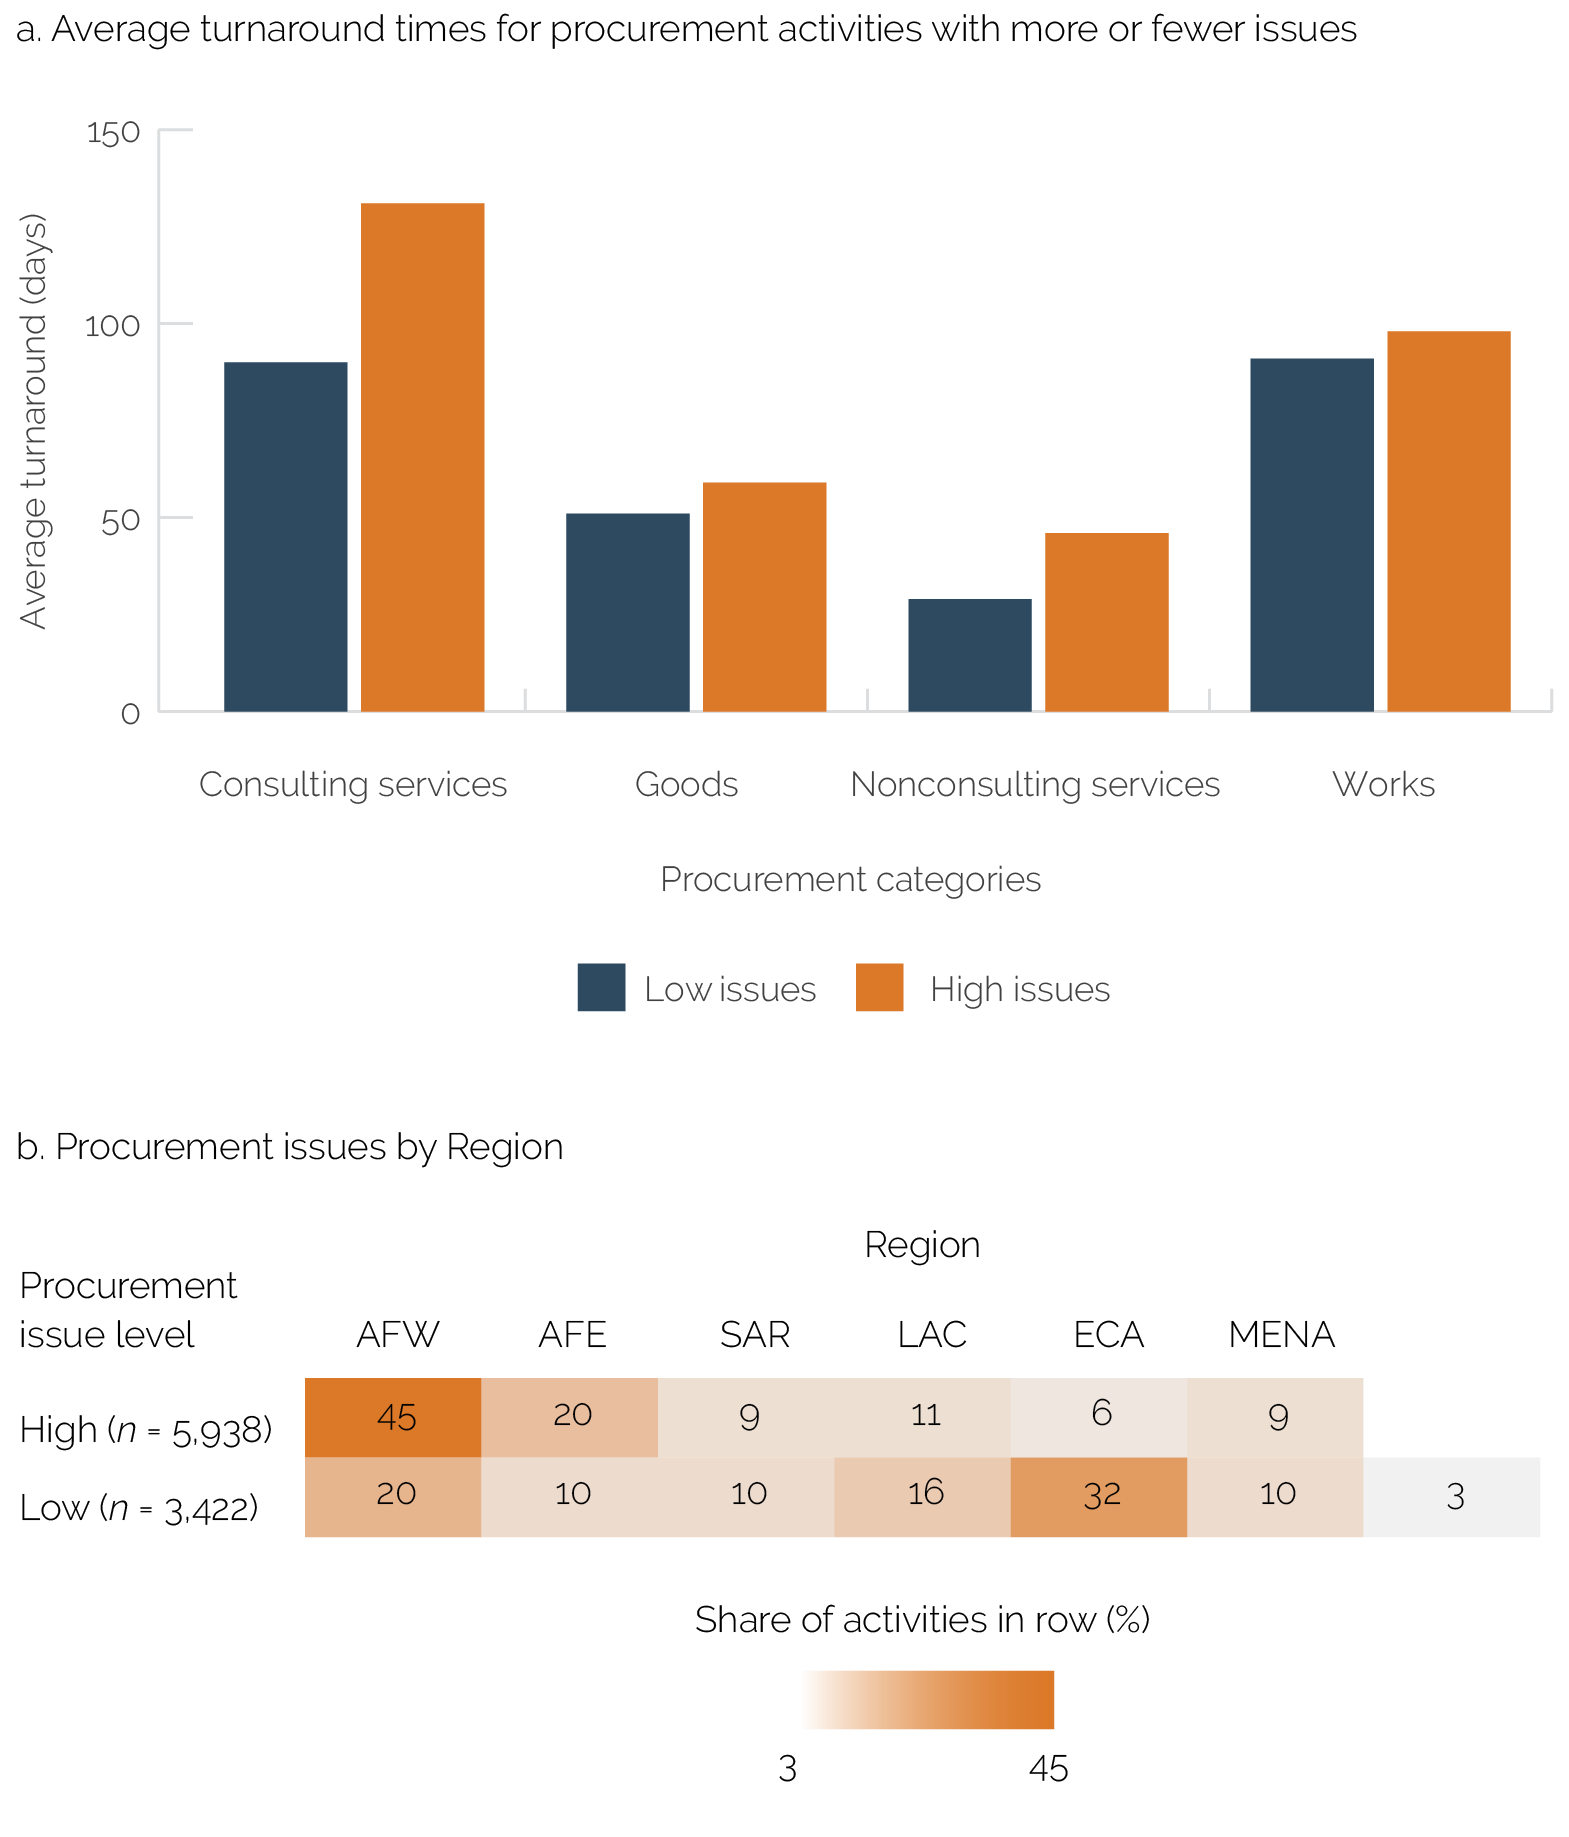
Procurement processing issues slow down procurement in World Bank–supported projects, especially in Africa. The most common procurement issues that cause processing delays, as reported in project Implementation Status and Results Reports (ISRs) and identified in case studies, are low-quality procurement documents that require revisions, such as terms of reference and bidding documents; difficulties following criteria to review bids during the evaluation stage, especially of works and consulting services; and late contract signings for consulting services (appendixes E and F). Task team leaders (TTLs) report such procurement processing issues in about half of the ISRs that IEG reviewed. Procurement issues are especially frequent when procuring consulting services. Procurement activities with these and other procurement issues take more than twice the time to process than projects without issues (figure 2.7, panel a), and issues are more common in procurement activities in Western and Central Africa where there is also more IPF procurement (figure 2.7, panel b).
Figure 2.7. Procurement Issues by Region and Difference in Turnaround Times

Source: Independent Evaluation Group Systematic Tracking of Exchanges in Procurement data analysis and ISR analysis.
Note: Panel a shows the average number of days to process procurement activities by category adjusted for outliers. Panel b shows the percentage of activities in projects with high and low issues by Region. Low = procurement activities in the bottom quartile of the number of procurement issues reported in their project ISRs; high = projects in the top quartile. The number of procurement activities in 237 projects with low or high levels of procurement issues reported in ISRs is 9,360. AFE = Eastern and Southern Africa; AFW = Western and Central Africa; EAP = East Asia and Pacific; ECA = Europe and Central Asia; ISR = Implementation Status and Results Report; LAC = Latin America and the Caribbean; MENA = Middle East and North Africa; SAR = South Asia.
Slowdowns because of procurement issues, notably at the bid and competitive evaluation stages, contribute to project implementation delays. Examining the contribution of different procurement stages to delays, STEP data show that preparing terms of reference, shortlisting and evaluating consultants, evaluating bids for works contracts, submitting bids for works contracts, and signing works contracts take a long time in projects with slow procurement, especially when projects report procurement issues in ISRs and delays (see figure C.13). These are all important stages in processing competitive procurement. Case studies consistently show delays at the same stages and that evaluating proposals for consulting services can take an especially long time in delayed projects (box 2.1).
Box 2.1. The Evaluation Stage of Consulting Services and Project Delays
Case studies show that evaluating proposals for consulting services takes an especially long time and can hinder project implementation. Projects rely on the timely processing of consulting services to provide technical expertise for project components. However, delays in finalizing terms of reference, evaluating technical documents, and finding qualified candidates can undermine procurement efficiency. For example, in the Federated States of Micronesia, at the project’s Mid-Term Review, no works had started because of delays in acquiring a consultant to help with the project’s needs assessment, design, and supervision. Similarly, in Colombia, the extended time it took to recruit consultants delayed a project’s water supply and sanitation works. In a Nigeria project, technical assistance activities for external evaluation of the results-based financing component were delayed until the project’s final year but required to verify the project’s indicators for disbursement. Conversely, in Pakistan, clients prioritized consultant contracts because they were necessary for up-front environmental services. As a result, contracts were awarded in about four months, supporting speedy implementation.
Source: Independent Evaluation Group case study analysis.
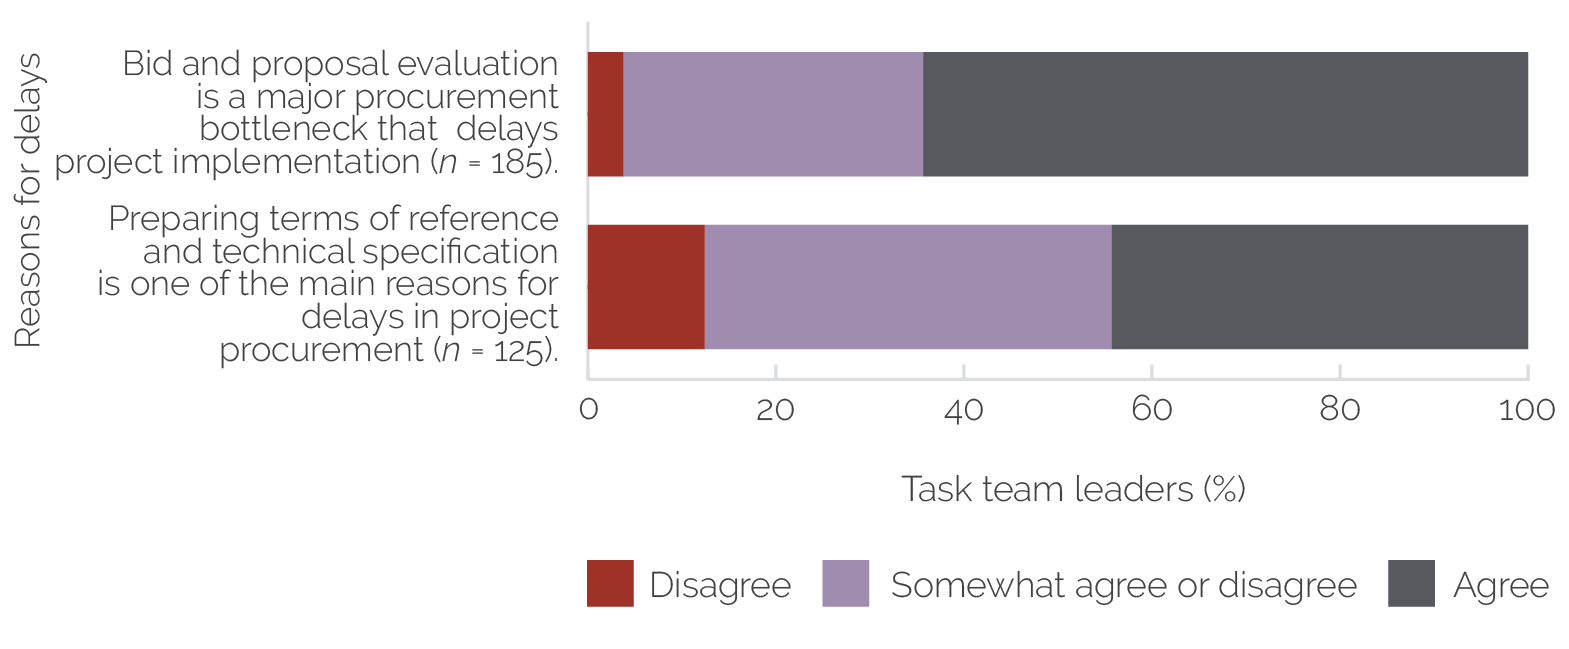
Most TTLs agree that evaluating bids and preparing terms of reference and technical specifications frequently cause delays. About 65 percent of TTLs believe that bid and proposal evaluations delay project implementation, and about 44 percent of TTLs believe that preparation of terms of reference and technical specifications delay project implementation (figure 2.8). About three-quarters of World Bank procurement staff, especially those working with lower-capacity clients, agree that preparing terms of reference and technical specifications are the main reasons for delays in project procurement. For example, in an energy project in Europe and Central Asia, unclear technical specifications and evaluation criteria caused the bid evaluation process to take almost nine months and led the World Bank team’s evaluation committee to reject the first round of bids. In other cases, delays were caused by committee members having limited experience with the evaluation criteria, even when technical specifications were of high quality. In Niger and Sierra Leone projects, delays in bid evaluation were caused by evaluation committee members being unwilling to meet because they are busy government officials with other responsibilities and did not receive a sitting allowance.
Figure 2.8. Reasons for Delays in Procurement according to Task Team Leaders

Source: Independent Evaluation Group procurement survey of task team leaders.
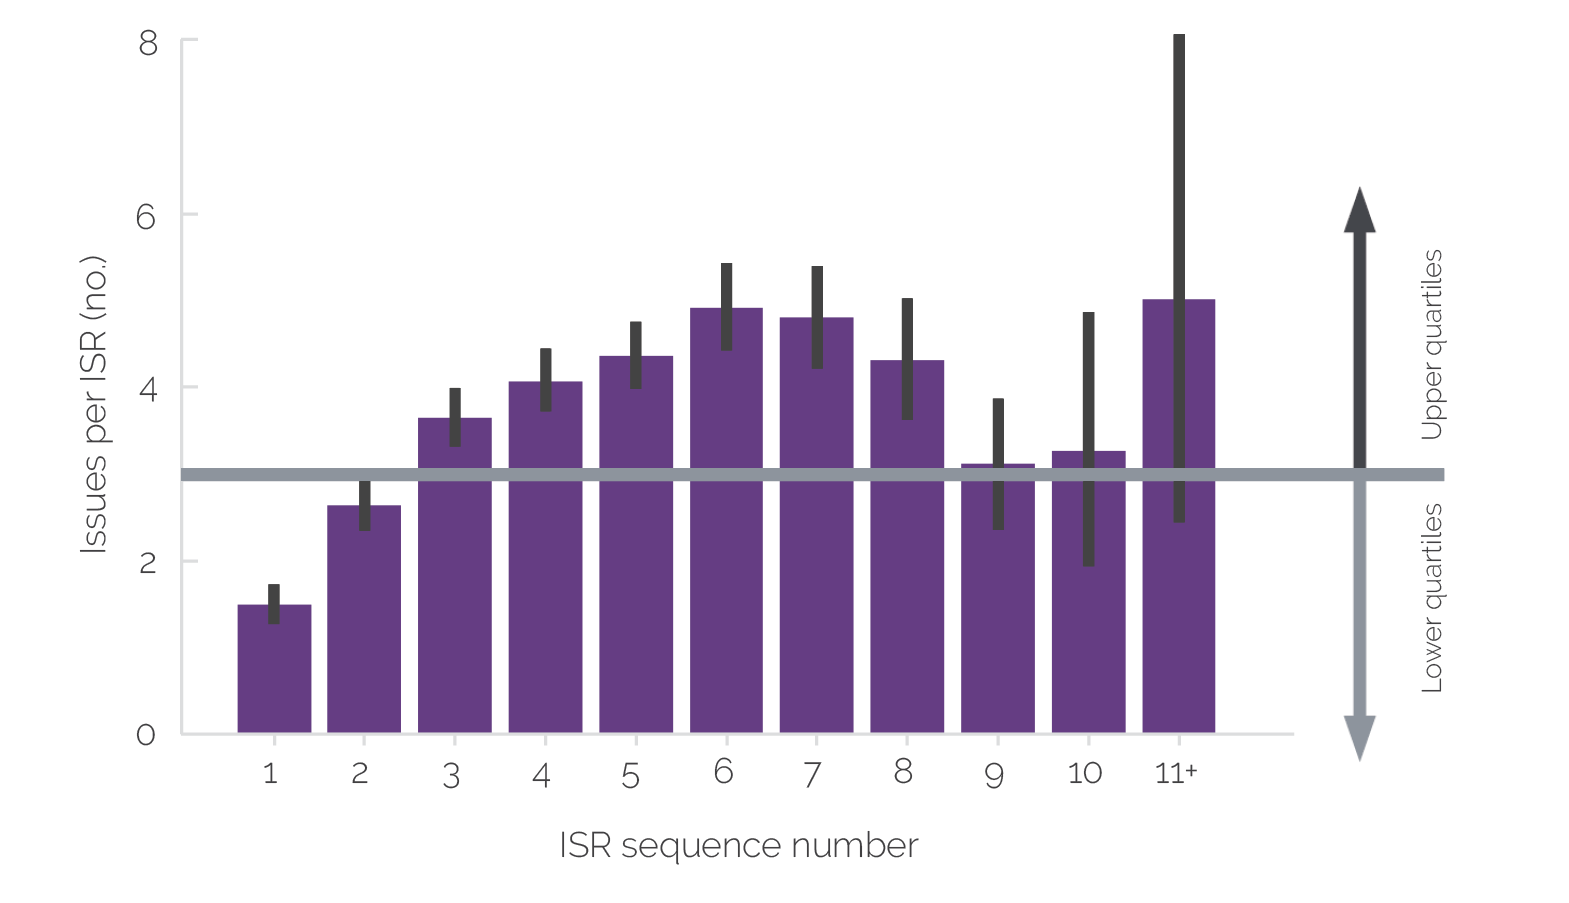
Procurement processing issues could be addressed earlier in the first year of implementation to prevent project implementation delays. Some projects report procurement processing issues in ISRs that delay implementation. The analysis of procurement issues reported in ISRs indicates that addressing issues early in project implementation could help prevent the issues from becoming delays. The reporting of issues in ISRs increases during implementation, and issues heighten at project midpoint (figure 2.9). Procurement issues are associated with overall project delays, suggesting that procurement is one of the main factors that affects project implementation (appendix E).6 For example, a project in Brazil was delayed because of difficulties in developing technical specifications for water and sewage connection contracts (which was the initial stage of project implementation). The project experienced significant implementation delays because this problem was not resolved promptly. ISRs report more issues when procuring, for example, information technology, laboratory equipment, and medical supplies. Across sectors, procurement issues in World Bank–supported projects are similar, although projects in the Energy and Extractives Global Practice report the most procurement issues. Projects in lower-capacity contexts often encounter procurement issues because of the limited experience of client procurement experts in projects and limited task team support to resolve them.
Figure 2.9. Frequency of Procurement Issues in Project Implementation Reports by Sequence

Source: Independent Evaluation Group country situation analysis.
Note: ISR sequences are reported every six months of a project. One project with 12 ISRs was combined with a group of projects with 11 ISRs. The median number of issues reported in an ISR was three, indicated by the gray horizontal line. The lower two quartiles of projects fall below the median (light-gray arrow), and the upper two quartiles fall above the median (dark-gray arrow). ISR = Implementation Status and Results Report.
Procurement Efficiency Improved by Technology with Opportunities for Enhancement for Clients
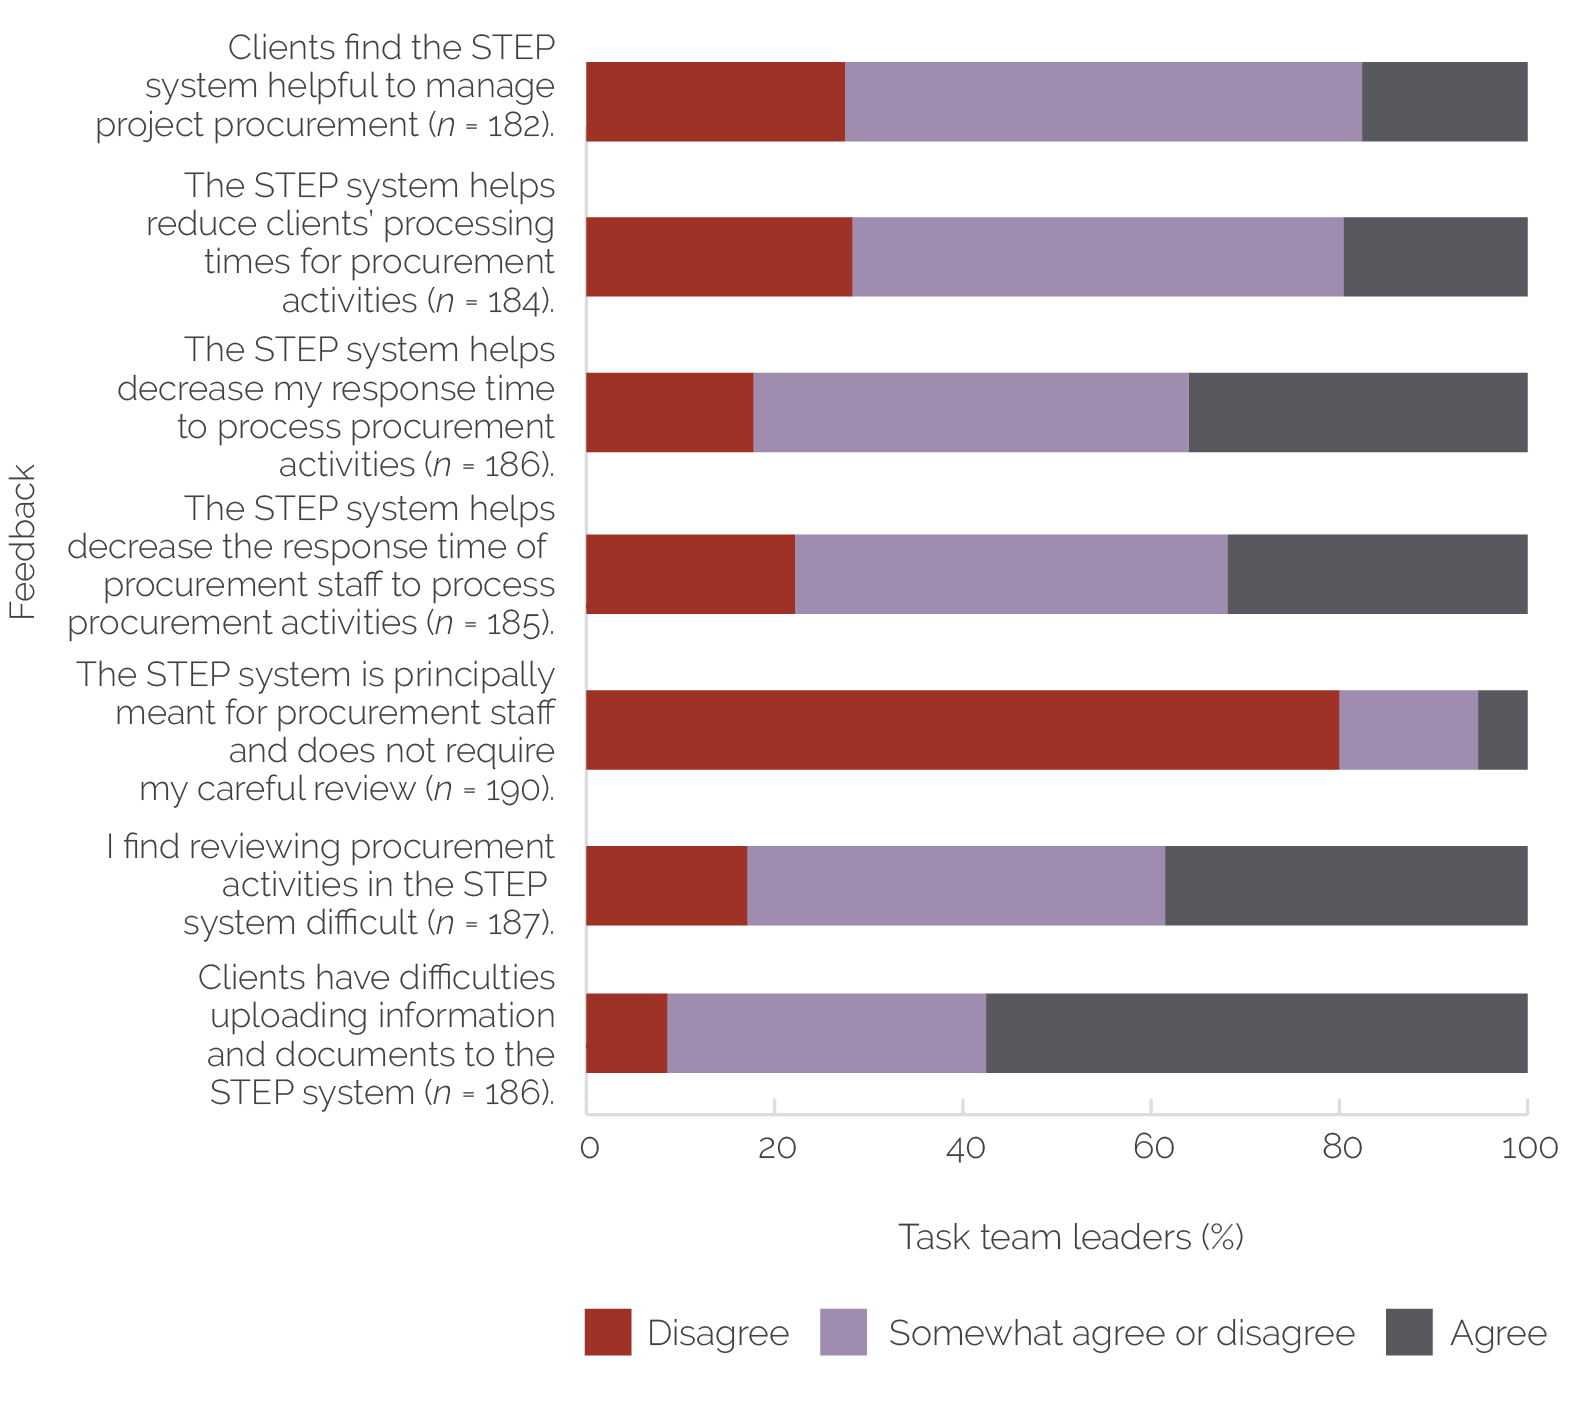
STEP—the World Bank’s electronic procurement tracking system—increases the efficiency of World Bank procurement reviews. Before the procurement reform, exchanges between clients and World Bank staff during the procurement review process occurred by letter, email, or in person. With STEP, clients upload procurement documents into the system, and World Bank staff and clients use the system for formal exchanges, such as document submissions, reviews, and nonobjections. In interviews, World Bank staff and clients recognize the need for an electronic system to review procurement activities. In surveys, over half of procurement staff agree that STEP reduces the response time of World Bank staff to process procurement activities. However, far fewer TTLs report that STEP helps reduce the World Bank’s response time: 36 percent state that it decreases their response time, and 32 percent state that it decreases procurement staff’s response time (figure 2.10). Other assessments of efficiency gains from e-procurement systems show that they reduce transaction and communication costs (Belisari, Appolloni, and Cerruti 2019; Brandon-Jones and Carey 2011), and STEP has achieved this objective to some extent according to findings from the evaluation’s case studies, interviews, and surveys.
Figure 2.10. Task Team Leaders’ Feedback on Electronic Tracking System for Procurement

Source: Independent Evaluation Group procurement survey.
Note: STEP = Systematic Tracking of Exchanges in Procurement.
The value and user-friendliness of STEP could be enhanced, especially for clients in low-resource contexts. Surveys show that few World Bank staff (18 percent of TTLs and 38 percent of procurement staff) believe that STEP helps clients manage procurement in World Bank–supported projects. In interviews, some clients appreciate that STEP enables them to track procurement activities in one place. However, other clients report that STEP duplicates their own procurement tracking systems, and they would prefer that the World Bank use their national systems instead of STEP or automatically import data from those systems to STEP. Surveys and case studies consistently find that STEP is difficult to use. For example, STEP prevents clients from easily updating information on stages of procurement transactions without the burden of contacting the World Bank headquarters and generates large volumes of unwanted automated emails. In case studies, clients in low-resource contexts report delays in uploading documents to STEP because of internet connectivity issues. In some countries, clients report that their project procurement specialists spend about half of their work time entering and uploading information to STEP. As a result, few clients enter all procurement activities into STEP because of the long amount of time it takes to do so. By contrast, clients with better internet connectivity, more training, and consultants on hand to oversee STEP report that recording procurement activities in STEP is efficient.
Trade-offs between Faster Procurement and Client Empowerment and Client Learning
Post reviews empower clients to take greater responsibility for their procurements, leading to improved capacity. The survey shows that approximately 50 percent of World Bank procurement staff agree and 10 percent disagree that procurement activities processed under post review (which rely on the client’s own procurement system) help strengthen the client’s procurement capacity (appendix G). Case studies also indicate that TTLs and clients valued this element of post review procurements. In addition, the survey shows that TTLs value the time saved from having fewer prior reviews more than World Bank procurement staff: about 40 percent of TTLs agree that fewer prior reviews reduce procurement processing times, whereas 24 percent of World Bank procurement staff agree (appendix G). As seen earlier, procurement activities subject to prior review have significantly longer processing times.
Reducing the number of prior reviews may free up World Bank staff time for more strategic activities, but clients in lower-capacity contexts often benefit from engagement with staff around procurement reviews. One of the goals of having fewer prior reviews is to free up time for World Bank procurement staff to provide more strategic procurement support, including helping clients develop procurement strategies, introducing innovations in procurement, and strengthening country procurement capacity. The survey shows that about half of World Bank procurement staff and TTLs agreed that this occurs. However, this is true for TTLs who work with higher-capacity clients (appendix G).7 Clients in low-capacity contexts often require help with reviewing procurement. For example, in Haiti, Mali, Niger, and Sierra Leone, clients request World Bank procurement staff to provide more informal reviews to fill the capacity strengthening gap that emerges from having fewer prior reviews. In Somalia, World Bank reviews of procurement help projects prevent integrity risks. The survey shows that about 10 percent of TTLs agree that clients have adequate capacity to manage procurement contracts with limited World Bank assistance. About 60 percent of TTLs agree that clients need significant World Bank support to process procurement contracts.
Clients value the learning they receive on World Bank standards during the World Bank staff procurement reviews. About 12 percent of projects have no prior review engagement with World Bank staff and emphasize a need for more engagement on important procurement to support project development objectives. World Bank procurement staff carried out prior reviews for approximately 20 percent of Infrastructure Practice Group activities because of their higher price tag and less than 10 percent of activities in other Practice Groups. In India, a small solar power procurement activity went through a prior review because of the market risk from introducing a new technology (which averted potential problems later). As such, planning a few activities that have prior review support from the World Bank helps clients learn the World Bank’s standards and improve procurement. The extra time it takes for a prior review might be a trade-off worth making for many clients.
- The turnaround time is the date from the start of the procurement activities to the first contract signing. The overall estimate includes procurement activities subject to both prior and post reviews and excludes data outliers.
- The current average turnaround time for procurement is 88 days, just over three months when looking at the evaluation period—fiscal years (FY)17–23. The estimate of 88 days excludes outliers. When looking by year, however, most of the procurement activities in the Systematic Tracking of Exchanges in Procurement system are for FY22 and FY23. This compares with 253 days in FY13 (World Bank 2014).
- The estimates of turnaround time include outliers to provide a more conservative comparison.
- A request for quotations involves suppliers submitting quotations. It may be through advertisement or invitation of a limited number of qualified suppliers. The evaluation of the quotations to award the contract is according to the criteria specified in the request for quotation. An electronic reverse auction (e-auction) is a scheduled online event in which prequalified suppliers can bid against each other on their price.
- Management capability risks refer to the procurement policies and human resource capacity of the client. Integrity and oversight risks refer to the risk of fraud and corruption in a country or agency. Processing risk includes risks of problems at procurement stages, such as evaluation or contract signing. Market risk refers to inadequate market response to a bidding process. Complexity relates to the procurement arrangements in the projects and procurement approaches.
- In some cases, problems related to extraneous factors, such as political issues in the country, that fall outside the scope of procurement cause project delays.
- The survey includes a question asking World Bank procurement staff and task team leaders whether they work in a fragile and conflict-affected situation or low-capacity country.


