
Meta-Evaluation of IEG Evaluations
Chapter 3 | Inventory of Methods
Evaluation question 3. Which methodological approaches (both standard and broadened) were used in the 28 IEG evaluation reports published between FY15 and FY19? How did the methods used in the evaluation reports compare with what was initially proposed in the Approach Papers guiding the evaluations? Did the evaluations explicitly discuss elements of research design?
An inventory of methodological approaches was conducted to explore the range and diversity of empirical strategies used in the evaluation reports and their corresponding Approach Papers. First, the inventory tallied the conventional evaluative methodologies used in corporate and programmatic evaluations. Next, the same was done for more innovative approaches, broadening the spectrum of methods used in evaluation. Finally, the inventory briefly examined the coverage of various research design attributes, measuring the extent to which evaluations and their supplemental appendixes discussed issues related to sampling, data collection, and operationalization. The following section provides a brief overview of the data collection and operationalization scheme used to generate the inventory, as well as a discussion of trends and insights derived from the data.
Summary of Main Trends
The inventory drew on the full universe of 28 evaluation reports and corresponding Approach Papers produced between FY15 and FY19. The sample included 8 corporate and 20 programmatic evaluations, with the analysis examining both the final reports and the corresponding Approach Papers that guided each evaluation.1
Data collection relied on a combination of automated and manual content analysis, using a series of tags representing the different methodological approaches referenced in the Approach Papers and evaluation reports. Automated content analysis (for example, bigram analysis) offered preliminary insights on the prevalence of methods in the universe. The models provided particularly useful information on the prevalence of conventional evaluative approaches such as portfolio reviews, statistical analysis, and semistructured interviews. These insights were then refined through manual analysis, which provided additional granularity to generate a representative image of the methods used in the universe of evaluations.
The inventory coded 13 conventional methods and 8 innovative ones used in evaluative analysis. Among the latter, the coding scheme examined the prevalence of content analysis, Bayesian modeling, network analysis, Delphi panels, evidence gap maps, geospatial analysis, process tracing, and qualitative comparative analysis (QCA). Of the innovative methods categorized in the inventory, “content analysis” refers to any procedures related to machine learning applications or automated content analysis, including text mining and computer-assisted classification or parsing. “Network analysis” includes methods related to social network analysis, organizational network analysis, or network modeling of any kind. “Geospatial analysis” includes the use of geographic information systems data, satellite imagery, or other geospatial methods.
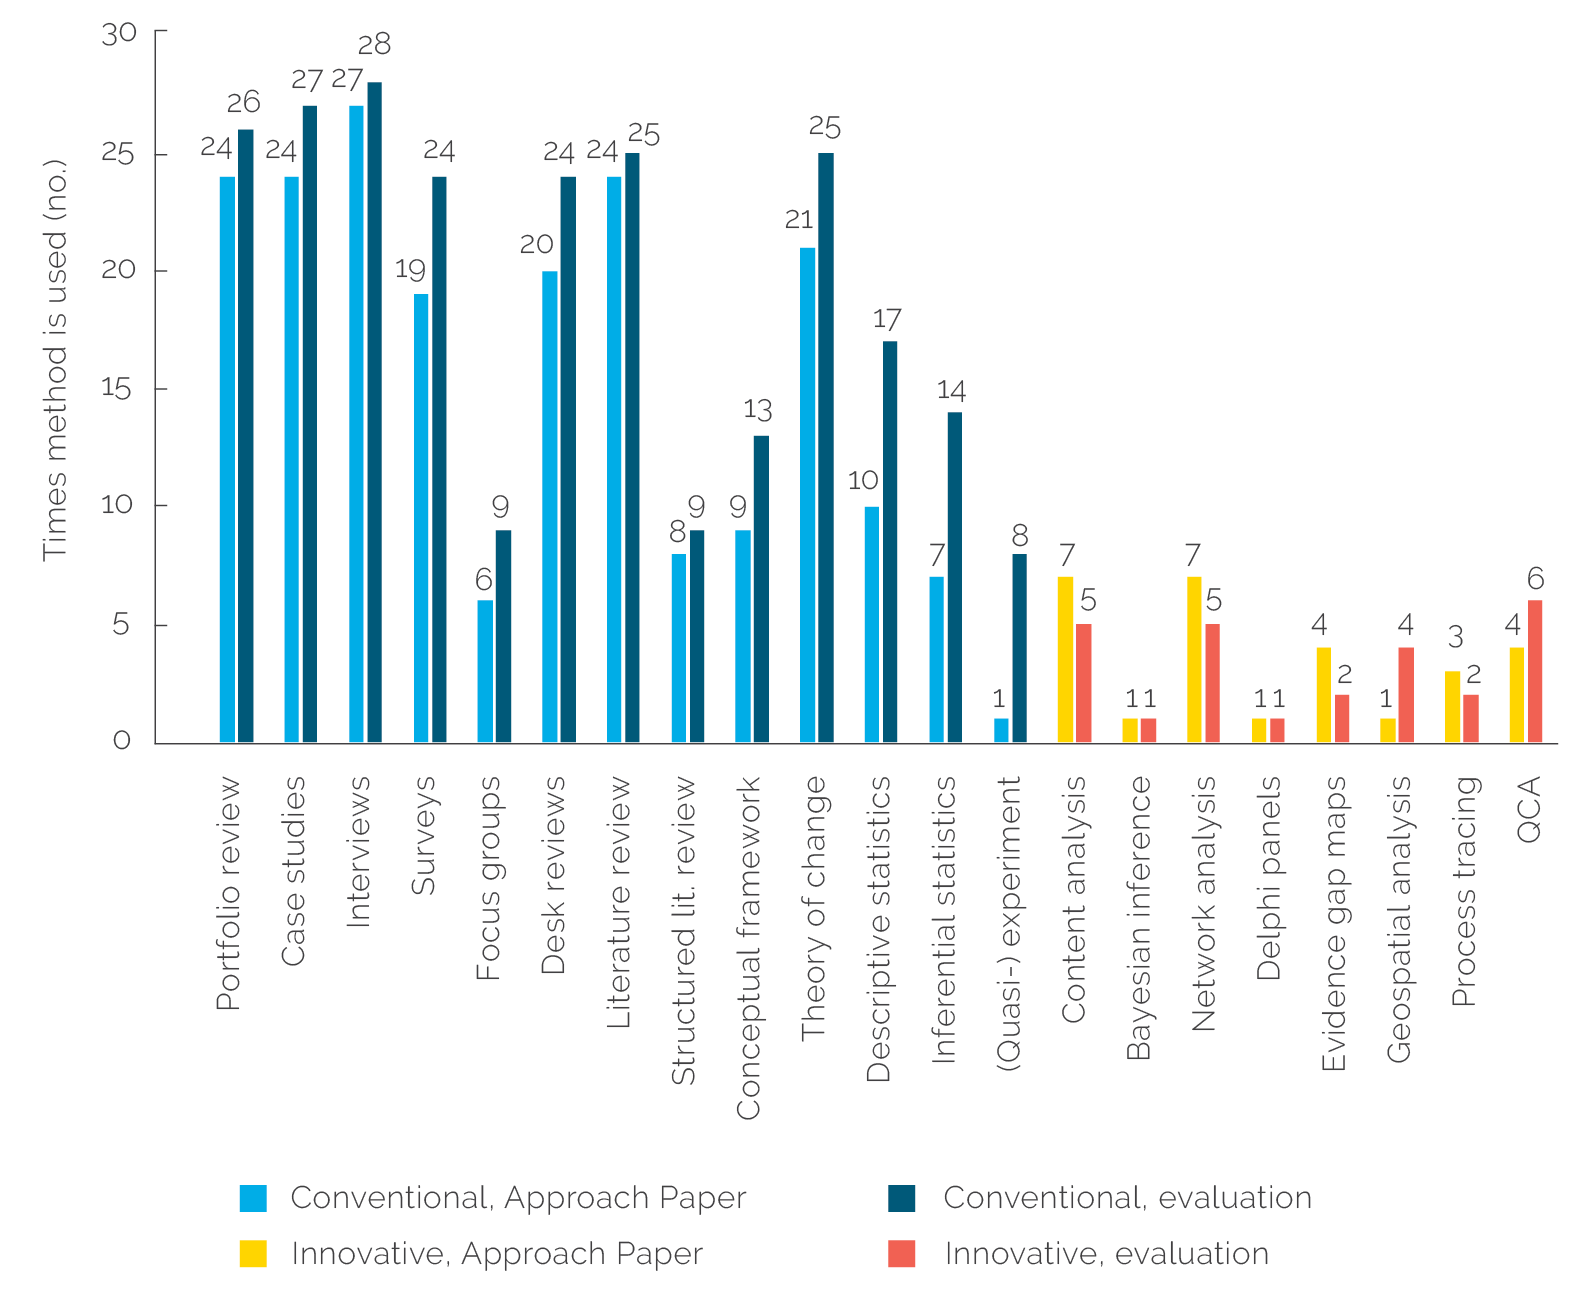
Figure 3.1 summarizes the output from the inventory of methods. The bars in blue represent the tally of conventional methods used in the universe, with darker bars representing output from evaluation reports (what was done) and the lighter bars output from the Approach Papers (what was proposed). The bars in orange represent the innovative methods used in the universe: once again, the lighter bars represent Approach Papers and the darker bars evaluation reports.2
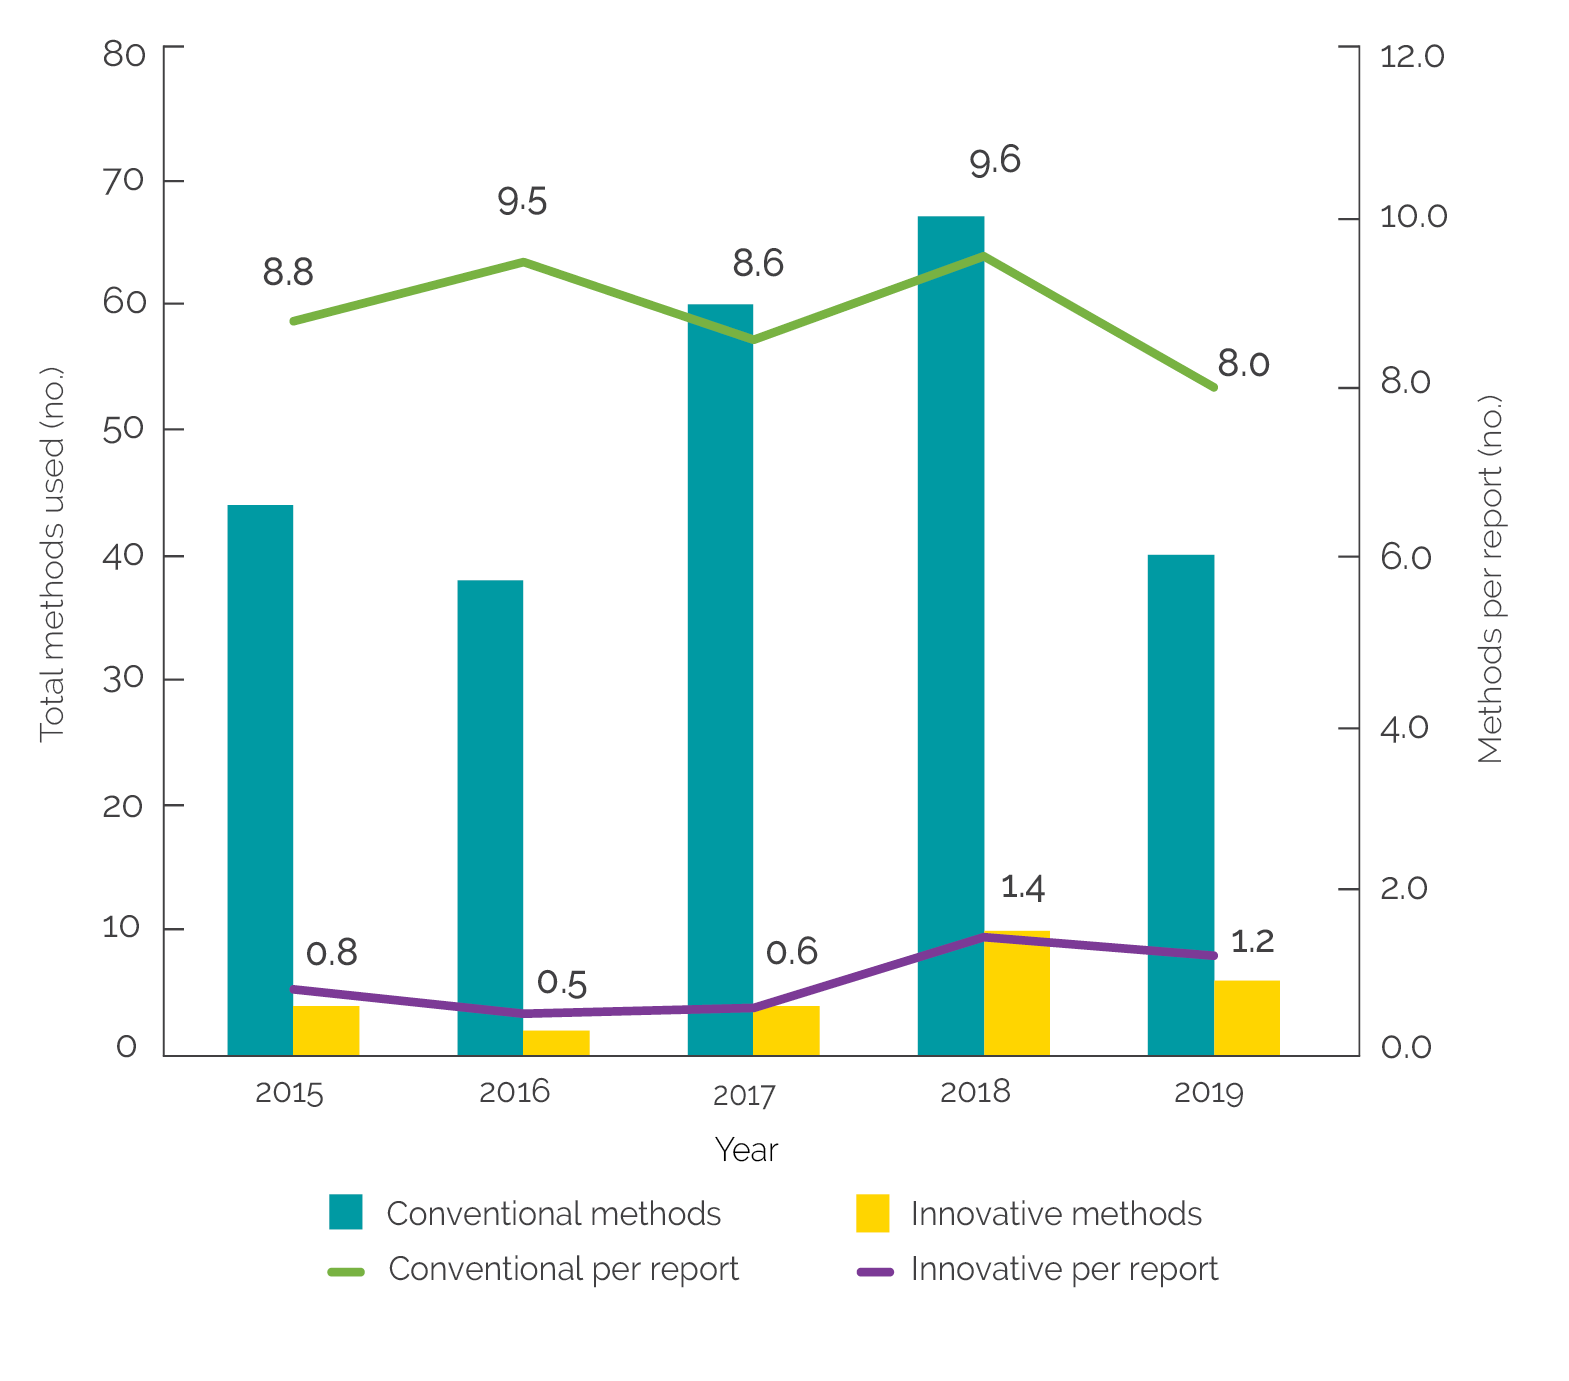
As can be seen, conventional methods such as case studies, structured interviews, and statistical analysis were relatively common across the universe of evaluations, with innovative methods like geospatial analysis and network analysis present in only a few of the evaluations. Nearly all evaluations employed some combination of interviews, case studies, desk reviews, and surveys. The total count of conventional methods tended to be higher in the final evaluation reports than what was initially proposed in the Approach Papers. The only apparent exceptions to this involved a few of the more innovative methods (for example, network analysis and content analysis, both of which appeared in seven Approach Papers but only five evaluation reports). Temporal analysis of the same data suggests that the use of more innovative methods increased in more recent evaluations: this is shown in figure 3.2. Annual tallies of methods employed in evaluation reports are shown along the axis on the left-hand side. Trendlines graph the average number of methods used per report, as shown on the right-hand axis.3
Figure 3.1. Inventory of Methods Referenced in Approach Papers and Evaluation Reports

Figure 3.1. Inventory of Methods Referenced in Approach Papers and Evaluation Reports
Source: Independent Evaluation Group.
Note: QCA = qualitative comparative analysis.
Figure 3.2. Prevalence of Methods over Time

Figure 3.2. Prevalence of Methods over Time
Source: Independent Evaluation Group.
The figure suggests that the average number of conventional evaluative methods used per report remained roughly consistent across the universe of evaluations, ranging between 8.0 and 9.6 approaches per evaluation report. However, there was a small but pronounced increase in the use of so-called innovative methods: while this number was less than 1.0 per report up to 2017, it increased to 1.4 and 1.2 in 2018 and 2019, respectively. In other words, the use of at least one innovative method per report appears to have become the norm in more recent evaluations.
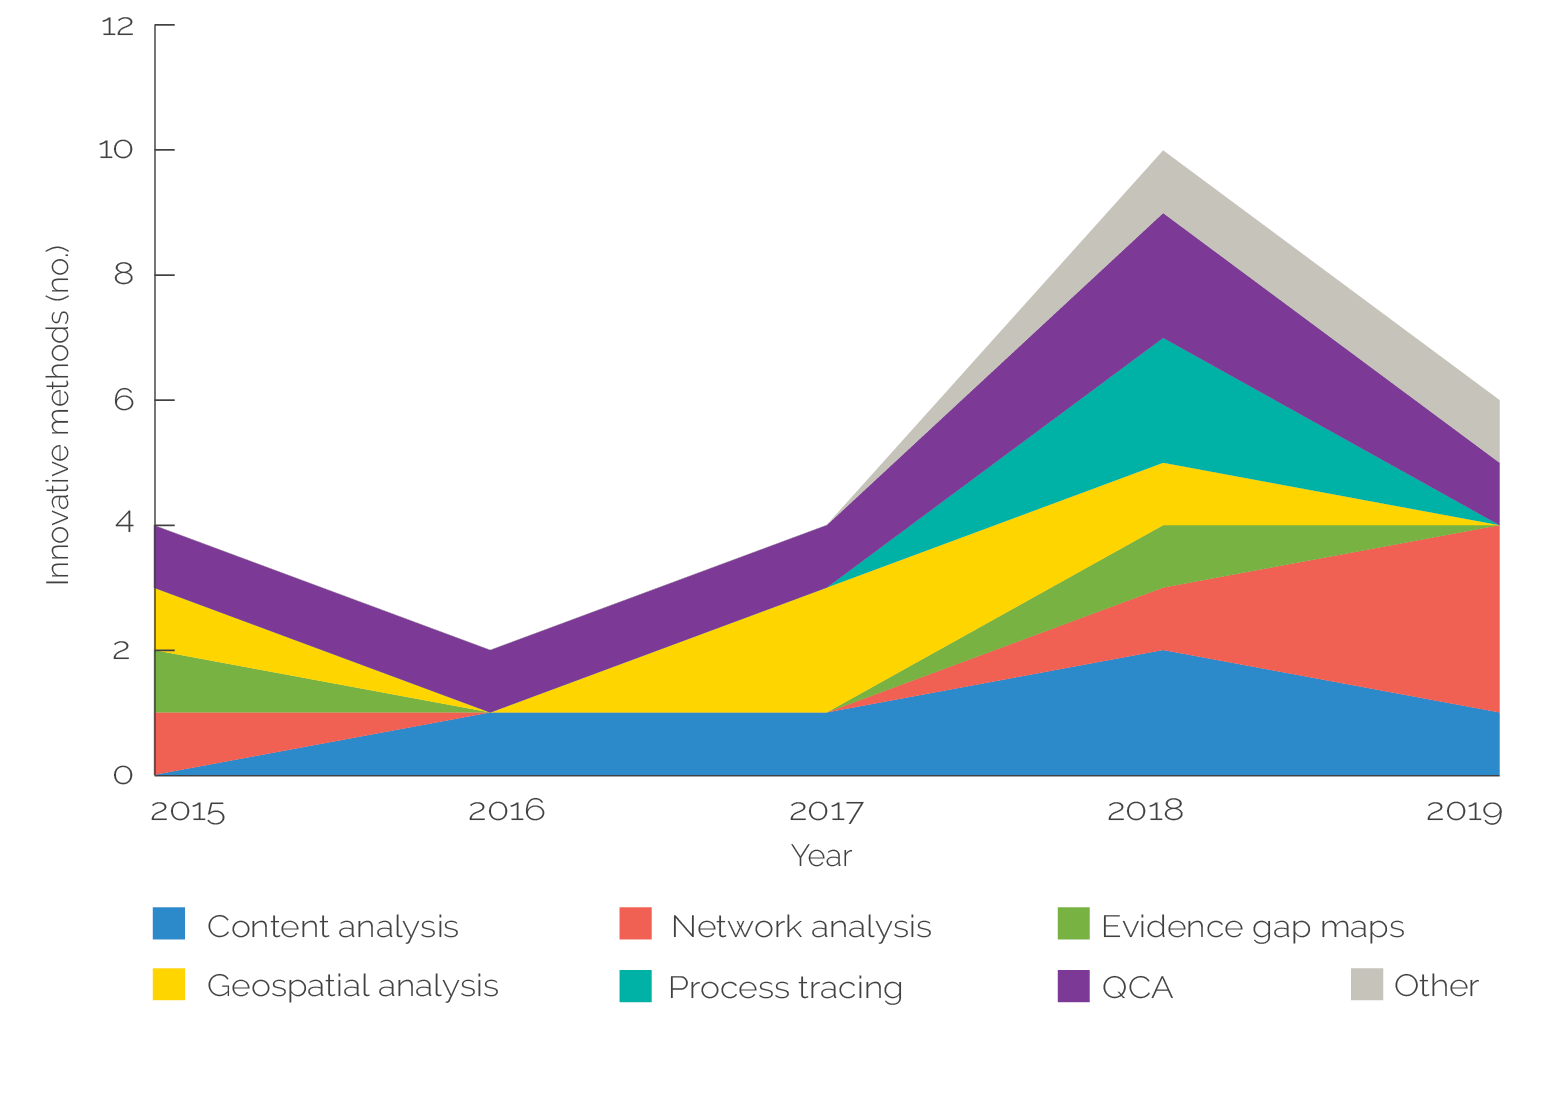
Figure 3.3 further disaggregates the use of innovative methods over time, graphing the prevalence of various approaches in the evaluation reports examined in the universe. Certain approaches such as network analysis and content analysis consistently feature in evaluation reports across the universe. Others, such as QCA, appear to peak in more recent evaluations, potentially suggesting a shift toward a more systematic analysis of case study and other qualitative data. This provides further support for the view that more innovative approaches to evaluation were used more frequently in more recent evaluations covered in the universe.
Figure 3.3. Distribution of Innovative Methods over Time

Figure 3.3. Distribution of Innovative Methods over Time
Source: Independent Evaluation Group.
Note: QCA = qualitative comparative analysis.
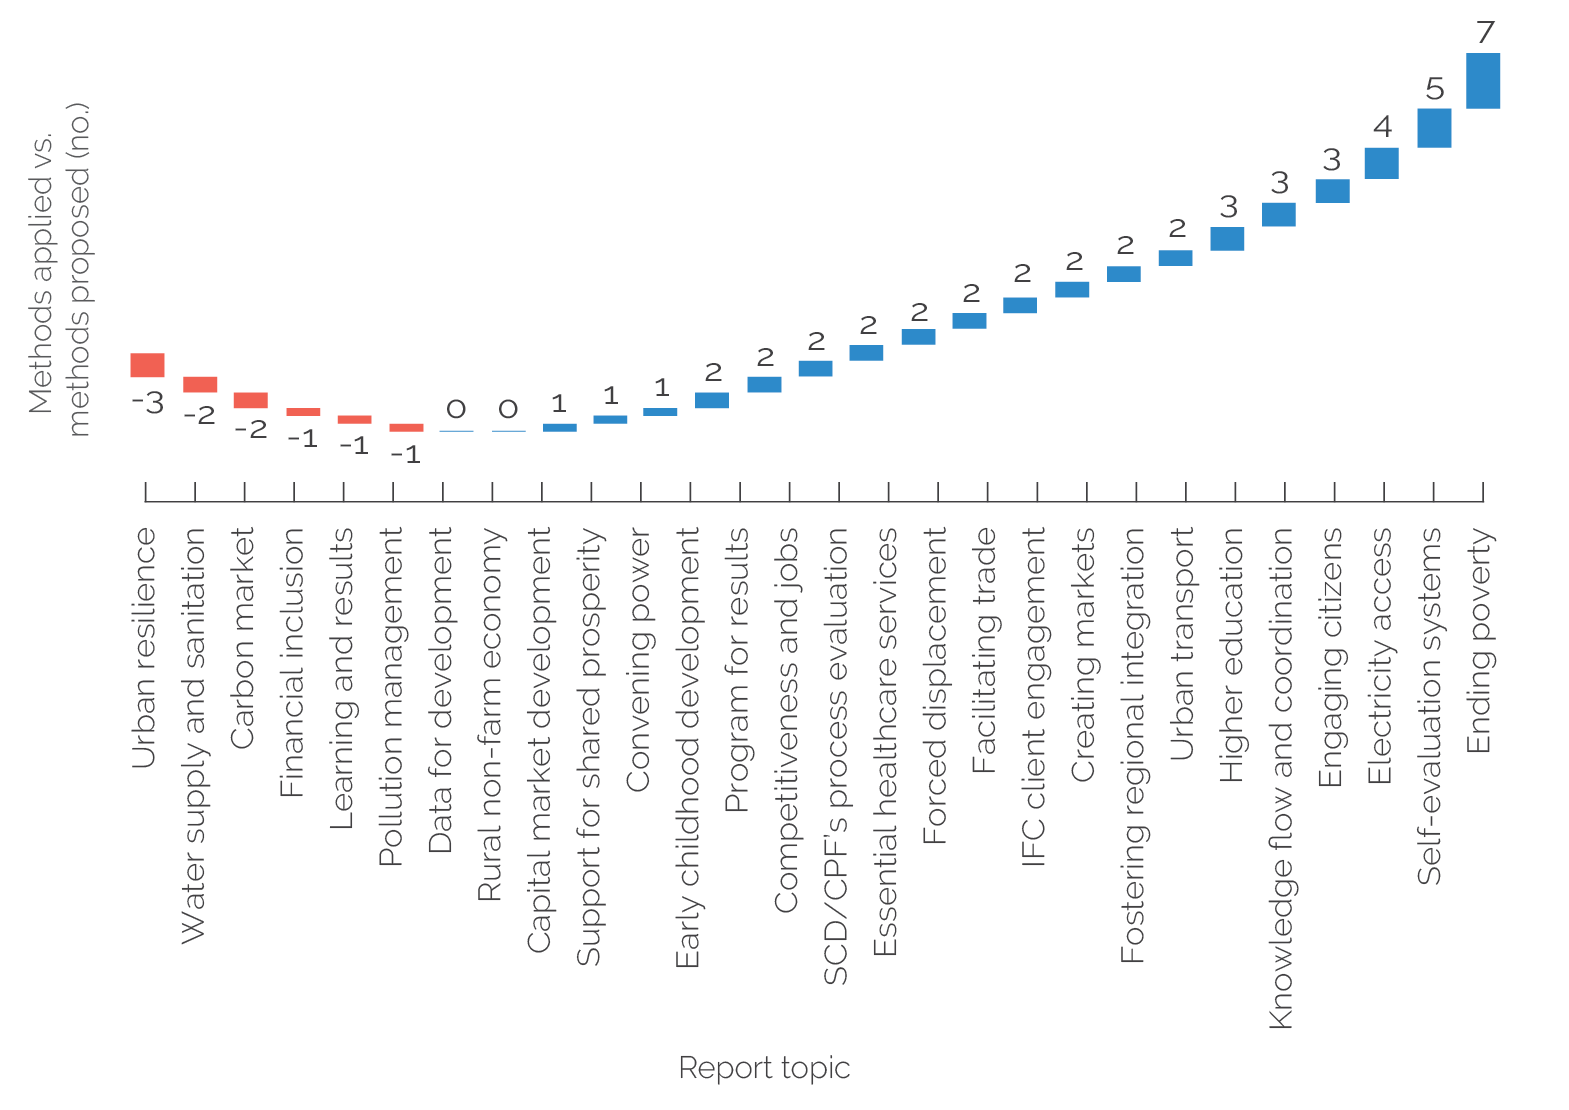
Data from the inventory were also used to compare the methodological approaches suggested for use in the Approach Papers to those that were ultimately delivered in the evaluation reports. As seen in figure 3.1, four of the eight innovative approaches were referenced in Approach Papers but not used in the evaluation reports (content analysis, network analysis, evidence gap maps, and process tracing). Figure 3.4 compares the number of methods listed in Approach Papers to those that were used in the final evaluation report for 27 of the 28 evaluations covered.4 The results showed that a majority of evaluations used more methods than their corresponding Approach Papers initially proposed.
Figure 3.4. Difference in Methods Tallies between Approach Papers and Evaluation Reports

Figure 3.4. Difference in Methods Tallies between Approach Papers and Evaluation Reports
Source: Independent Evaluation Group.
Note: This figure provides the evaluation topic or short title. For complete information, see appendix A.
As shown in figure 3.4, a minority of evaluations used fewer methods in the evaluations than were initially proposed in the Approach Papers: for example, the urban resilience evaluation (FY19) ultimately used three fewer methods than were proposed in the corresponding Approach Paper (World Bank 2019b). However, most evaluations ultimately used more methodological approaches than initially proposed. In the starkest case, the self-evaluation systems evaluation (FY16) ultimately featured seven more methods than were initially proposed (World Bank 2016a). The graph also suggests that the majority of reports tended to roughly align with their Approach Papers on the issue of methodological diversity: all but seven evaluations diverged from their Approach Papers by only one or two methods. It should be noted that the discrepancies in methods proposed versus used between Approach Papers and evaluation reports can have many reasons (many of them entirely justifiable), and there is no single clear interpretation possible.
In sum, the inventory highlights the breadth of methodological approaches featured in the evaluation reports, tallying the frequency of use of different analytical tools over time. While the output suggests that innovative methods remain somewhat underused in major evaluations, such methods have also gained traction, with more recent evaluations relying on a broader spectrum of approaches to address complex evaluation challenges. This trend is expected to grow as more evaluations take advantage of cutting-edge tools to better use available qualitative and quantitative evidence.
The inventory also captured the extent to which evaluations paid attention to special issues such as gender and data transparency. The inventory tallied all references to these issues across all available Approach Papers and evaluation reports. The results of this analysis are summarized in figure 3.5. The graphs show the total percentage of all evaluations and Approach Papers that address such issues in each indicated year.5
Figure 3.5. References to Special Issues in Approach Papers and Evaluation Reports

Figure 3.5. References to Special Issues in Approach Papers and Evaluation Reports

Source: Independent Evaluation Group.
Note: AP = Approach Paper; ER = evaluation report.
Nearly all reports included references to data transparency and gender, with 21 of 28 evaluation reports referencing the former and 22 of 28 evaluation reports referencing the latter. For both issues, the final evaluation reports (logically) featured more references than the corresponding Approach Papers. Finally, the inventory took stock of references to various research design elements within the evaluations. Specifically, relevant methodological appendixes were judged based on whether they discussed the sampling, data collection, and causal analysis strategies employed in the evaluation. Furthermore, the reports were examined for discussions of potential limitations and adequate links to the evaluation question(s). The results from this probe are graphed in figure 3.6.
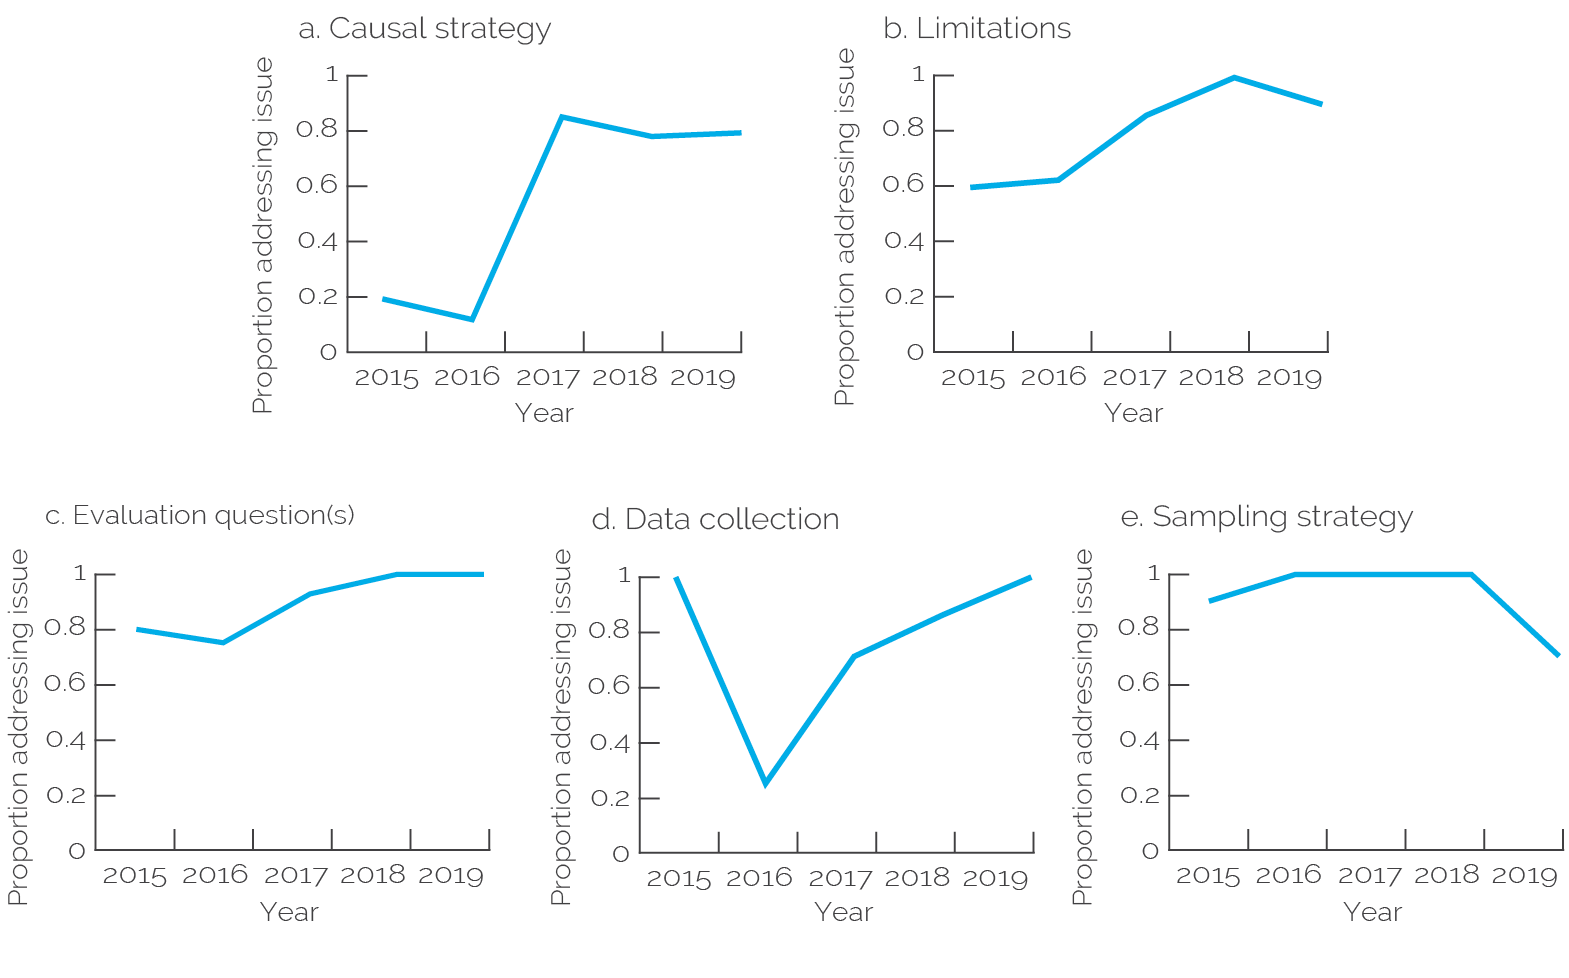
Figure 3.6. References to Research Design Attributes in Evaluation Reports

Figure 3.6. References to Research Design Attributes in Evaluation Reports
Source: Independent Evaluation Group.
References to research design parameters were either stable or increased slightly over the time period assessed, with some fluctuations attributable to the total number of evaluations assessed in each year. Nearly 90 percent of the appendixes discussed the sampling strategy used in the evaluation, along with the limitations of the methodological approach employed. About 85 percent of all evaluations linked the methodological strategy to specific evaluation questions, and 78 percent discussed the data collection strategy used. About 65 percent of evaluations incorporated the issue of causal identification into the analysis, though coverage of this issue increased over time.6
Examining the development of these trends over time, we see that nearly all evaluations linked their methodological approaches to specific evaluation questions, a trend that remained roughly consistent over time. Likewise, most evaluations discussed the sampling strategy used in data collection, though this practice fell in FY19, with only about 70 percent of reports explicitly discussing sampling procedures. Except in FY16, a majority of evaluations elaborated on the data collection methods used in their supplemental appendixes. More evaluations discussed the limitations of their empirical strategies over time. Likewise, discussions of causal strategy increased substantially from FY17 onward. Overall, with the exception of references to data collection (low outlier in FY16), we see high and stable values in relation to evaluation questions and sampling strategy as well as a positive trend over time on clarity in terms of limitations and causal strategy.
Data from the inventory presented in this section provide a broad overview of the range and diversity of methodological approaches used in the 28 evaluations examined in this meta-evaluation. The inventory highlighted the breadth of methodological approaches featured in the full universe of assessed evaluations, highlighting the ways in which such tools have been leveraged to address a broad range of evaluation questions across the Bank Group’s diverse portfolio of activities. Conventional methods such as case studies, structured interviews, and statistical analysis are relatively common across the universe of evaluations, with innovative methods like geospatial analysis and network analysis present in only a minority of the evaluations studied. However, the prevalence of innovative methods increased in more recent evaluations, suggesting an upward trend. Finally, a growing number of evaluations have been providing a more developed elaboration of their research design by discussing data collection procedures, causal strategies, and potential limitations with increasing frequency.
- The only exception to this was the ending poverty (FY15) evaluation, for which no Approach Paper was provided (World Bank 2015c).
- See appendix E for an expanded analysis of the methodological inventory.
- Averages were calculated to offset the differences in the number of evaluations completed each year. For example, there were only four evaluation reports in 2016 (hence the lower overall tally), but each report used an average of 9.5 methodological tools.
- As noted above, the ending poverty (FY15) evaluation had to be excluded from this analysis because no Approach Paper was provided for it (World Bank 2015c).
- As a caveat to these data, it should be noted that such a tally provides at best a crude instrument for the assessment of such complex issues. Questions related to the coverage of these concepts in IEG evaluations merit a more in-depth exploration, one that is outside the scope of this report.
- The inventory also examined references to hypotheses or hypothesis-testing frameworks. However, issues of data sparsity made it difficult to reach any meaningful conclusions about trends pertaining to that parameter. As such, it was not included in the analysis of research design attributes.