
The World Bank Group’s 2018 Capital Increase Package
Chapter 5 | Priority Area 4: Improving the World Bank Group’s Internal Model
Highlights
The capital increase package (CIP) emphasized efficiency commitments to tighten budget discipline, whereas the Forward Look emphasized putting in place the human capacity to deliver on the World Bank Group’s various strategies, including by investing in staff.
Prominent CIP initiatives, such as the Agile Bank was discontinued. The International Bank for Reconstruction and Development (IBRD) has instead reported on actions to improve its internal operating model through organizational reforms, human resources initiatives, and enhanced assessment tools and policy frameworks. None of these actions were CIP policy measures or commitments.
Changes by the International Finance Corporation (IFC) to its internal operating model included establishing the portfolio approach, the Anticipated Impact Measurement and Monitoring system, the Accountability and Decision-Making Framework, regional vice presidencies through decentralization efforts, and a new workforce composition.
Both IBRD and IFC have fully implemented the CIP’s financial sustainability commitments. This allowed IBRD to increase its crisis lending and fast-disbursing loans and contributed to IBRD’s financial sustainability by increasing its capital base and income and optimizing its balance sheet—all of which allowed IBRD to expand lending. IFC also took several steps to enhance its financial sustainability, including updating its capital adequacy framework and economic capital model, which allowed IFC to strengthen its capital base.
This chapter covers the CIP clusters on improving the effectiveness and financial sustainability of the Bank Group’s internal operating model. It analyzes IBRD and IFC clusters separately in the following order: (i) IBRD’s operating model effectiveness, (ii) IFC’s operating model effectiveness, (iii) IBRD’s operating model financial sustainability, and (iv) IFC’s operating model financial sustainability.
The CIP’s operating model commitments do not fully capture the Forward Look’s objectives. More specifically, the CIP commitments do not comprehensively cover the Forward Look’s emphasis on improving the scale, results, learning, innovation, staff incentives, and improvements to the Bank Group’s evaluation framework. For example, the Forward Look proposed a new human resources (HR) initiative to strengthen staff capacity—the people strategy—which the CIP did not pursue. Instead, the CIP featured efficiency commitments to tighten budget discipline, with a substantive cost savings and cost avoidance target of $1.8 billion for the FY19–30 period. To achieve this, the Bank Group implemented efficiency measures to control costs related to the workforce, corporate procurement, and global real estate and Bank Group facilities. This validation did not assess IBRD’s and IFC’s budget commitments and related savings measures because GIA will cover these in its upcoming Assurance Review of CIP commitments and their governance.
Table 5.1. CIP Policy Measures for Improving the World Bank Group’s Internal Model
|
World Bank Group Policy Measures (Effectiveness) |
Commitments |
Indicators |
Targets |
|
Further implementing “agile” reforms and administrative simplifications to deploy World Bank Group resources more efficiently. |
Further implementing “agile” reforms and administrative simplifications to deploy Bank Group resources more efficiently, including through
CIP main text. Not underlined but listed in annex summary of the capital package. |
No indicator in CIP implementation status table. Reported in implementation updates narrative. |
No target. |
|
The Bank Group—Introducing a range of new efficiency measures, including managing salary and workforce growth and achieving savings in corporate procurement and real estate and savings from administrative simplification and agile approaches. These measures, in addition to the continuous implementation of the Expenditure Review measures, will help maintain budget discipline.a |
Revise staff compensation methodology to control salary growth and pursue other human resources measures. CIP main text. Not underlined but listed in annex summary of the capital package. |
Revised staff compensation methodology adopted. |
Complete (yes/no). |
|
IBRD—The new Environmental and Social Framework is being rolled out to help improve the sustainability of investments. |
No commitment. Not underlined in CIP and not listed in annex summary of the capital package. |
No indicator in CIP implementation status table. Reported in implementation updates narrative. |
No target. |
Source: Independent Evaluation Group.
Note: CIP = capital increase package; IBRD = International Bank for Reconstruction and Development.a. This commitment is outside the validation’s scope as mentioned in chapter 1.
It was difficult to assess the effectiveness results from changes to the operating model because of a lack of measurable data. Table 5.1 shows four CIP policy measures and two commitments related to the Bank Group’s operating model effectiveness, but only one indicator related to the adoption of a revised staff compensation methodology, which is not aligned with institutional metrics and does not reflect the effectiveness of the implemented changes. The results from the IBRD and IFC implementation of this cluster proved hard to validate because some key initiatives were abruptly discontinued without explanation, many reform outcomes were unknown, monitoring and reporting were inconsistent, and there were no documented attempts to learn from the implementation’s successes and challenges. This lack of details stands in contrast to the CIP’s detailed and carefully monitored capital adequacy and cost reduction targets.
Operating Model Effectiveness of IBRD
World Bank management has taken steps during the review period to enhance the effectiveness of IBRD’s internal operating model. These steps include the following CIP policy measures: procurement reforms, the Agile Bank initiative, and the Environmental and Social Framework (ESF). The World Bank also undertook additional reforms to improve IBRD’s internal model effectiveness that were not explicit policy measures or commitments but were described in CIP progress reports, such as trust fund reforms; the decentralization of staff and decision-making, known as the global footprint; and enhancements to its Country Engagement Framework, including increased outcome orientation. These efforts were organized in three categories that are explained in this chapter: (i) organizational reforms, (ii) assessment tools and policy frameworks, and (iii) HR initiatives.
Organizational Reforms
World Bank management discontinued the Agile Bank initiative. Launched in 2016 and listed in the CIP as a formal commitment, the Agile Bank initiative was designed as a long-term flagship program to enhance the World Bank’s operating model and promote a culture of continuous improvement, seeking enhanced cost efficiency, operational quality, and simplified administrative processes. The initiative consumed extensive resources. For example, the initiative had engaged with approximately 1,800 staff after its first year in 2017. By the end of FY19, the initiative piloted more than 170 interventions across all Regions and, of those, mainstreamed 11 interventions into World Bank operations, mainly to simplify project cycle documents and streamline administrative processes and procedures (World Bank Group 2019a). The World Bank quietly discontinued the initiative, and, consequently, there is limited evidence of its results.
CIP implementation updates from FY20 onward ceased to report on the Agile Bank initiative, and its results are unclear. This initiative used the staff engagement survey’s “engagement index” and client feedback on World Bank responsiveness to assess the initiative’s effectiveness. However, the resulting indicators do not fully measure the initiative’s underlying objectives and show little change over time. Moreover, targets for these indicators were conservatively set in IBRD’s CSC, only slightly above their baseline values. The abrupt and quiet end of reporting on this initiative, which was the most prominent commitment in this cluster, is a missed opportunity for learning about the World Bank’s organizational change management.
The World Bank’s trust fund reforms have been generally successful and are still under implementation. The World Bank started these reforms independently of the CIP but reported on them in the CIP updates. The reforms consolidate the World Bank’s trust fund portfolio into fewer programs that fall within larger Umbrella 2.0 programs, under a single governance structure with a common monitoring and reporting framework. So far, the reforms consolidated hundreds of stand-alone trust funds into 71 umbrella programs, of which 62 have so far become active. As of the end of FY22, 88 percent of the World Bank’s trust funds are channeled through these umbrella programs with the remainder being stand-alone funds. It is still too early to assess the reform’s outcomes because most are still active, but, according to management’s reporting and interviews done for this validation, reforms led to better managerial oversight of the World Bank’s trust fund portfolio, increased oversight of fundraising, and improved monitoring and reporting.
The links between trust funds and operations are not always strong. Such links would enhance the strategic alignment within IBRD’s operating model. However, internal processes do not yet reflect this alignment according to IEG interviews, IEG’s convening evaluation, and the World Bank’s internal reports (World Bank 2020c, 2022j). Alignment can be particularly challenging for trust fund programs in themes that cut across organizational boundaries. It is also challenging because trust fund resource allocation is not usually aligned with operational budget cycles.
Assessment Tools and Policy Frameworks
The World Bank’s ESF was approved in August 2016 and made operational in October 2018. The ESF was a CIP policy measure that protects people and the environment from the potentially adverse impacts from World Bank–financed projects. It uses a risk-based approach to monitor 10 social and environmental standards that projects are expected to meet. This approach requires more subjective judgment than the earlier mandate-focused safeguard policies, which the ESF replaced. The World Bank rolled out the ESF with defined procedures, staff guidance, implementation tools, and a new monitoring system. The World Bank also trained over a thousand staff and organized workshops on the new framework with borrowers and other stakeholders.
Implementing the ESF has proven challenging. Interviews and surveys point out that after its first year of implementation, the ESF’s flexible risk-based approach was not always practiced by staff because of risk aversion (GIA 2020). Moreover, many borrowers had an insufficient understanding of the new framework. Borrowers’ steep learning curve was exacerbated by delayed ESF trainings and their need to respond to urgent COVID-19 demands (World Bank 2022k). There was also a shortage of accredited World Bank environmental and social specialists to support borrowers. A comprehensive IEG evaluation of the ESF is planned for FY25.
The World Bank introduced a new Procurement Framework for investment financing. The Procurement Framework, which became effective in July 2016 and was a CIP policy measure, promotes shorter processing times for loans, applies value-for-money and fit-for-purpose principles in project designs, expands the range of procurement tools and techniques for project managers, and provides hands-on implementation support to clients in FCV and low-capacity countries. According to World Bank management’s 2022 retrospective, the new Procurement Framework improved borrower capacity, increased the value for money of loans, streamlined procurement processes, and increased competition in contract bidding (World Bank 2022e).
The Bank Group’s country strategies now frame their objectives in terms of country outcomes (World Bank 2020b). The Bank Group (2021b) updated its country engagement guidance in July 2021, in line with the Forward Look’s objective to improve the outcome orientation of country programs. The new guidance proposes a structured approach for country program strategies to set high-level outcomes that are anchored in the country’s development priorities. So far, operational units have been successful in implementing this guidance according to this validation’s review of 18 country engagement documents. The review shows that recent CPFs have started to focus more clearly on a few high-level development outcomes rather than outputs and targets. However, according to IEG’s 2020 evaluation of the World Bank Group’s outcome orientation at the country level (World Bank 2020b), CPF results frameworks continue to mainly capture the effects from past operations, creating a timing mismatch between CPF’s objectives and their measurement. Furthermore, IEG’s evaluation found that country-level results systems produce little value and are rarely used by operational teams. Despite this, country programs have made few discernible attempts at reforming these results reporting systems (World Bank 2020b).
Human Resources Initiatives
In 2016, the Bank Group developed and implemented a comprehensive people strategy, thereby achieving a Forward Look target. The Forward Look promoted the FY17–19 Bank Group people strategy to strengthen the Bank Group’s internal capacity by enhancing Bank Group staff’s skills, improving employment conditions, and steering the organizational culture toward achieving results and innovation, among others. To develop the people strategy, the Bank Group reviewed workforce trends, benchmarked these trends against other institutions, and consulted more than a thousand staff and managers in over 120 engagement sessions. The Bank Group’s roll out of the strategy was accompanied by a detailed implementation plan (organized in 18 thematic clusters) and a scorecard with 42 indicators—four of which were directly associated with the CIP’s operating model effectiveness cluster.
IBRD’s CIP commitments were not aligned with the people strategy, nor with the spirit of the Forward Look’s HR objectives. The CIP’s operating model effectiveness policy measures did not reinforce the people strategy’s or the Forward Look’s objective to strengthen Bank Group staff capacity. By contrast, the CIP’s HR approach centered on cost efficiency measures that capped merit increases and reduced the number of high-level, mostly technical GH-level positions through so-called grade optimization.
The short-term duration of the Bank Group’s HR monitoring frameworks makes it hard to assess HR strategies’ effectiveness. The people strategy was designed to cover the period FY17–19, and when this period concluded, a new strategy was developed for FY20–22. Reporting on the people strategy stopped in late FY18 when a reorganization of the HR department eliminated the department’s strategy reporting function. Only a few of the people strategy scorecard metrics were monitored after FY18. Similarly, changes to the staff engagement survey in FY17 combined survey questions covering budget, HR, and information technology processes and procedures into a single question: “Internal administrative processes and procedures enable me to conduct my work effectively?” which reduced the visibility of HR-specific perceptions; in FY16, the engagement survey had showed that only 32 percent of staff had a favorable perception of HR processes.1
The World Bank’s decentralization of staff to the field, or the expanding of its global footprint, has strengthened the World Bank’s responsiveness in client countries. Decentralization led to benefits, such as increased trust from clients, more in-depth understanding by World Bank staff of country contexts and political economies, increased Bank collaboration with field-based partners, and quicker and more frequent operational support, particularly in fragile, conflict-affected, and low-capacity countries. However, it had some downsides, such as reducing some aspects of global knowledge sharing. IEG’s evaluation on the global footprint also raised concerns about management using broad quantitative staffing targets to drive the decentralization without clarity on its expected outcomes. As a result, Regions and Global Practices made decisions to send staff to the field to meet staffing targets rather than to meet country needs (World Bank 2022a).
IBRD management’s changes to indicators measuring staff presence in FCS made it hard to validate decentralization trends. CIP implementation updates have reported an increase in staff deployed to FCS and nearby locations since 2020. However, changes in indicator definitions made this reported increase impossible to validate. For example, the FY17–20 people strategy scorecard’s indicator reported that 723 staff were based in FCS locations,2 but the FY22 CIP implementation update’s indicator reported 738 World Bank staff working in 19th Replenishment of IDA FCS, a smaller and different set of countries. The Bank Group’s March 2022 implementation update on operationalizing its FCV strategy reported just 85 staff working in or on IDA FCS in December 2021 against a target of 100 (World Bank Group 2020b). IDA’s results measurement system tracks an FCV Facetime Index, which measures visiting and resident staff and consultant days worked in country (IDA 2022). Using different indicators at different times to measure decentralization meant that there was no way to accurately track changes to the World Bank’s global footprint in FCS.
Operating Model Effectiveness of IFC
Reporting
IFC’s policy commitment to improve its internal operating model’s effectiveness has been comprehensively reported by several reports, despite some shortcomings in the CIP reporting. As shown in table 5.1, the validation could not identify any quantitative indicators at the CIP approval stage to track IFC’s CIP commitment to enhance its internal operating model effectiveness. CIP updates on its progress in this cluster did not systematically report on certain effectiveness initiatives, providing varying accounts of progress from one report to another. For example, some effectiveness initiatives are explained in great detail in updates from certain years but are not reported at all in other years. However, Strategy and Business Outlook updates and budget papers provide more comprehensive information on the implementation of model effectiveness initiatives. CSCs and staff engagement surveys also contain indicators that are indirectly related to IFC’s internal model effectiveness.
Implementation
IFC has implemented measures to enhance the effectiveness of its internal operating model in accordance with CIP mandates. The goals of these measures, as described in the CIP document, include trimming bureaucracy, simplifying approval procedures, enhancing the development impact of project portfolios, and improving organizational effectiveness. IFC’s measures to achieve these goals include the AIMM system, which identifies project development outcome claims and produces rating scores for these claims’ expected and actual results; the portfolio approach, which balances the share of the portfolio that has high expected profitability but lower development impact (which tend to support IFC’s financial sustainability), with the share of the portfolio that has lower expected profitability but higher development impact (which tend to be IDA or FCS projects); the Accountability and Decision-Making Framework and the Credit Delegation Framework, which intend to establish clear roles for IFC’s staff and operating units and allows management to make quicker decisions and support clients more efficiently; and the platform approach, which groups projects of a similar nature under a single lending envelope to allow IFC to expedite processing times, reduce transaction costs, and enhance synergies among the projects. As part of a decentralization initiative, IFC took additional measures, such as reintroducing regional vice presidents, decentralizing staff to countries and regions, and moving global upstream staff to regional departments. As described in chapter 4, this last measure changed IFC’s original upstream model within only two and a half years of its inception. Despite these various decentralization efforts, the share of IFC staff based in the field has seen only marginal growth, from 55 percent in FY18 to 57 percent in FY22 (IFC 2018, 2022a). It has also defined HR-related goals in the workforce planning exercise, such as reducing staff costs, improving the staff skills mix, and strengthening the staff rewards and incentives program. IFC launched voluntary and nonvoluntary separation programs during FY19 and FY20 that removed a notable share of GH-level staff.
It is hard to assess IFC’s operating model effectiveness because of reporting shortcomings and the limited time IFC has been implementing these measures. As discussed in this chapter, IFC’s reporting on this cluster has not been systematic. Moreover, it is still too early to evaluate the long-term outcomes of these reforms because such reforms inherently require a significant amount of time to produce results.
Initial results suggest that IFC’s portfolio approach and workforce planning have had some successes. This validation’s initial review indicates that the portfolio approach has been achieving its goal of balancing IFC’s portfolio distribution. This included a notable increase in the share of project designs with high expected development outcome and low expected financial returns, as reported in the regular operational updates to the Board. However, this reporting does not indicate the ex post balance of IFC’s portfolio distribution, and the portfolio approach’s overall effectiveness is subject to a formal evaluation.3 IFC exceeded its workforce planning target of reducing GH-level staff by 10 percent: GH-level staff decreased from 17 percent in FY18 to 13 percent in FY22—a 24 percent decrease (IFC 2022a). Nevertheless, workforce planning’s impact on staff morale and capacity is unknown because the effect from losing senior talent on business performance or new employee capacity was never assessed.4
IFC’s operating model effectiveness initiatives did not achieve their goals yet, according to IFC’s CSC and staff engagement survey. The CSC and staff engagement survey results do not show the desired improvements—at least not yet. IFC took an important step in this direction by including AIMM scores, which include market outcome scores, in its CSC. AIMM-related CSC indictors show mixed results in enhancing project development outcomes. Although the average ex ante AIMM score and the portfolio AIMM score have been improving, the ex ante AIMM scores have been below the FY18 baseline. Moreover, the CSC indicator—mandate to disbursement—failed to meet its target every year between FY18 and FY22 despite management’s claims that the Accountability and Decision-Making Framework and platform approach’s results are promising (IFC 2019). In addition, the staff engagement survey did not show an increased share of employees believing that internal administrative and operational procedures enabled high-quality services to the clients. The lower-than-expected results for IDA FCS lending would suggest that decentralization efforts have not yet translated into increased lending volumes in targeted country segments. GIA’s audit of the Cascade approach showed that offering rewards to staff for adopting this approach has not been effective. This could have been expected because a limited number of one-time staff incentives is less powerful compared with incentives that lead to enduring benefits (for example, incentives that drive career advancement, such as meeting lending volume targets).
Financial Sustainability of IBRD
Table 5.2 shows that the CIP contained a single commitment to introduce a new FSF for IBRD. The FSF’s purpose was to align IBRD’s lending with its long-term sustainable lending capacity, ensure efficient use of IBRD’s capital, and retain IBRD’s flexibility to respond to crises. The CIP monitored this commitment through a single yes or no indicator, which is clear and measurable, and management complemented with detailed reporting, as described in this chapter.
Table 5.2. CIP Financial Sustainability Policy Measures for IBRD
|
IBRD Policy Measures for FSF |
Commitments |
Indicators |
Targets |
|
Introduce an IBRD FSF with the following objectives:
|
Introduce an IBRD FSF. Not underlined in CIP but listed in annex summary of the capital package. |
New IBRD FSF introduced. |
Complete (yes/no). |
Source: Independent Evaluation Group.
Note: CIP = capital increase package; FSF = Financial Sustainability Framework; IBRD = International Bank for Reconstruction and Development; IDA18 = 18th Replenishment of the International Development Association; SALL = sustainable annual lending limit.
Reporting
There has been excellent reporting on IBRD’s implementation of the CIP’s financial sustainability cluster. Annex 2 of the CIP document described IBRD’s FSF objectives and principles in detail. These principles were endorsed by the Board of Governors in April 2018. The World Bank’s Executive Directors approved the CIP’s FSF in December 2018. The FSF’s implementation approach stipulated that FSF reporting and discussions with the Executive Directors would be regular throughout the year. Consequently, IBRD’s FSF reporting has been systematic and consistent from year to year, covering the sustainable annual lending limit (SALL) estimate, potential crisis buffer sizes, financial lending terms, and downside risk cases. The CIP’s annual reports also covered these areas and described the FSF’s implementation outcomes.
Implementation
IBRD fully implemented its CIP FSF measures and regularly updated the Executive Directors on its progress. Since the Executive Directors’ approval of the CIP’s FSF objectives and principles in December 2018, management has consistently updated them on IBRD’s lending program, 10-year SALL, buffer-adjusted SALL, and crisis buffer. IBRD’s process of updating the FSF was synchronized with the Board’s annual decision-making timeline in relation to budgets, loan pricing, and income allocation. In March of every year, the Executive Directors discussed a paper with a preliminary update on the SALL amount, crisis buffer sizes, and the resulting buffer-adjusted SALL. In addition, since December 2020, IBRD conducted an annual midyear review to consider potential adjustment to the crisis buffer. This resulted in continuous revisions to the buffer, the SALL, and IBRD’s lending ceiling. For example, the Executive Directors approved two adjustments to the financial terms of IBRD’s FY21 lending and, thereafter, established regular pricing for countries to access the crisis buffer and adjusted maturity limits for fast-disbursing operations.
Implementation of IBRD’s financial package increased IBRD’s capital base, increased its income from lending, and optimized its balance sheet.5 IBRD’s shareholders contributed $4 billion in paid-in capital as of June 2022, or 54 percent of the total agreed capital subscription, thereby increasing IBRD’s equity-to-loan ratio by 0.5 percentage points relative to what it otherwise would have been. This leaves room to expand IBRD’s lending before it reaches its minimum equity-to-loan ratio of 20 percent. In addition, loan pricing measures, including steepened maturity premiums for IBRD clients and differentiated approaches for different country income groups, as discussed in chapter 2, have increased IBRD’s lending income by $39 million between FY19 and FY21.6 Moreover, IBRD’s income transfer to IDA became contingent on IBRD’s long-term financial strength.7 IBRD also took measures to optimize its balance sheet and free up resources for additional lending through active portfolio management that included loan cancellations and restructurings. In FY20, management reviewed IBRD’s capital adequacy framework and statutory lending limits and decided not to revise them.
The FSF, including the crisis buffer, allowed IBRD to increase its crisis lending and provide more fast-disbursing loans. As shown in table 5.3, IBRD authorized $20 billion in crisis buffers for the FY20–23 period in response to COVID-19 and other crises, doubling the original expectation of a $10 billion crisis buffer. Actual usage of the crisis buffer was $10.6 billion in FY21 and FY22, whereas the latest buffer-adjusted SALL was $27 billion for FY23, slightly lower than expected. IBRD’s commitment volumes have been increasing since FY19, reaching a $33 billion commitment in FY22. IBRD’s fast-disbursing loans, which performed a de facto crisis lending role because of the adjustment of the financial terms, also increased.8 IBRD’s outstanding portfolio has also been growing since FY19, while its actual allocable income levels decreased in FY21 and FY22.9 Despite these changes, IBRD’s equity-to-loan ratio stayed in the 22.6–22.8 percent range from FY19 to FY22, remaining above the policy’s minimum ratio of 20 percent. (In April 2023, the policy minimum E/L ratio was changed to 19 percent.)
Rating agencies confirmed that IBRD’s FSF has protected its credit worthiness and AAA ratings. Moody’s Investors Service stated that IBRD’s AAA rating reflects its prudent financial policies, effective risk management strategy, and strong credit worthiness. According to Moody’s Investors Service (2022a), IBRD achieved this credit worthiness because of its (i) high capital adequacy, robust risk management framework, preferred creditor status, and strong asset performance; (ii) ample liquidity buffers and exceptional access to global funding markets; and (iii) large cushion of callable capital and its shareholders’ willingness and ability to support it. Likewise, S&P Global (2023) highlighted similar reasons for IBRD’s credit worthiness and confirmed that the capital increase helped increase IBRD’s lending ceiling.
IBRD’s full use of the current crisis buffer and further increases to the crisis buffer may undermine IBRD’s lending capacity in FY24 and beyond. Management’s latest paper on SALL levels for FY23 indicates that IBRD will maintain its financial sustainability for the medium term. IBRD’s equity-to-loan ratio is expected to remain above the 20 percent minimum over the same period, even under plausible downside scenarios.10 The statutory lending limits, which stood at $339 billion in FY22, leave adequate room to increase IBRD’s lending further, according to the management’s paper on the FY23 SALL level.11 However, the same paper also stated that IBRD reaching the SALL ceiling by FY23 would result in a marked decline in its lending capacity for FY24 and beyond. Therefore, IBRD’s continued authorization and use of the crisis buffer may undermine future SALL and buffer-adjusted SALL amounts.
Table 5.3. IBRD Lending Limits and Key Financial Sustainability Framework Performance Metrics
|
Performance Metrics |
FY18 |
FY19 |
FY20 |
FY21 |
FY22 |
FY23 |
|
IBRD crisis buffer approved ($, millions) |
n.a. |
n.a. |
10,000 |
10,000 |
5,000 |
5,000 |
|
IBRD crisis buffer available (including carryover; $, millions) |
n.a. |
n.a. |
10,000 |
10,000 |
9,500 |
9,500 |
|
IBRD crisis buffer used ($, millions) |
n.a. |
n.a. |
0 |
5,500 |
5,100 |
|
|
Lending ceiling ($, millions) |
n.a. |
n.a. |
38,000 |
35,000 |
37,500 |
36,500 |
|
SALL-adj ($, millions) |
n.a. |
n.a. |
28,000 |
25,000 |
28,000 |
27,000 |
|
Actual commitment |
23,002 |
23,191 |
28,500 |
30,500 |
33,072 |
|
|
Actual loans outstanding |
183,588 |
194,787 |
204,231 |
220,600 |
227,092 |
|
|
Actual allocable income |
795 |
1,190 |
1,381 |
1,248 |
806 |
|
|
Actual equity-to-loan ratio (%) |
22.1 |
22.8 |
22.8 |
22.6 |
22.8 |
Source: Independent Evaluation Group based on data from the CIP proposal, IBRD Management’s Discussion and Analysis and Financial Statements, CIP annual reports, and IBRD’s internal database.
Note: CIP = capital increase package; FY = fiscal year; IBRD = International Bank for Reconstruction and Development; n.a. = not applicable; SALL-adj = buffer-adjusted sustainable annual lending limit.
Financial Sustainability of IFC
IFC’s FSF consists of operational and financial strategies to conserve capital. The FSF’s aim is to preserve IFC’s AAA rating, use capital efficiently, and maintain sustainable incomes to cover IFC’s operating expenses. Table 5.4 shows that the CIP monitored this commitment with a single yes or no indicator—continued application of the existing IFC framework with relevant enhancements—which has some shortcomings, as discussed in this chapter. Some other policy measures under CIP’s financing package but not specific to this cluster—namely, those related to loan terms, balance sheet optimization, and income transfers—are also relevant to IFC’s FSF.
Table 5.4. CIP Financial Sustainability Policy Measures for IFC
|
IFC Policy Measures for FSF |
Commitments |
Indicators |
Targets |
|
Continuing application of the existing framework, which contains the following:
|
Continue application of the existing IFC framework and improve certain aspects of the framework through (i) formal review and reaffirmation of the DSC policy range annually, (ii) keeping abreast with evolving standards in risk and capital models, and (iii) establishment of more granular policy ratios. CIP main text. Not underlined but listed in annex summary of the capital package. |
Continued application of the existing IFC framework with relevant enhancements. |
Implemented (yes/no). |
Source: Independent Evaluation Group.
Note: CIP = capital increase package; DSC = deployable strategic capital; FSF = Financial Sustainability Framework; IFC = International Finance Corporation.
Reporting
IFC has reported comprehensively on its CIP FSF implementation, albeit through various types of reports. The objectives, key measures, and parameters of IFC’s FSF were approved by the shareholders as part of the CIP proposal. There is no requirement to develop a single formal document that comprehensively reports on IFC’s FSF implementation. Annual CIP reports only briefly summarize this implementation, but they do provide complementary information on the CIP’s financial package, such as loan terms, balance sheet optimization, and income transfers. The annual Strategy and Business Outlook reports provide information on the FSF’s implementation. There are also reports that focus on specific aspects of the FSF—such as IFC’s annual reports on financial risk management, capital adequacy, and economic capital—and annual budget reports on the FSF’s income designation.
IFC’s monitoring mechanism for its FSF commitments has a few shortcomings. First, its FSF commitments and other relevant financing package areas are qualitative and are not accompanied by time-bound indicators. Moreover, the only indicator for IFC’s FSF implementation is not very informative. This indicator—continued application of the existing IFC framework with relevant enhancements—reports only that IFC updated and enhanced its capital adequacy framework in the first quarter of FY22. This provides some information on the implementation of new FSF measures, but nothing on measures that are not new. As described in this chapter, various factors, such as portfolio growth, financial returns, and capital adequacy, affect IFC’s financial sustainability. In this regard, indicators on liquidity, asset quality, capital adequacy, and financial returns for both the debt and equity portfolios would provide a more comprehensive accounting of IFC’s financial sustainability. These indicators have been comprehensively and regularly reported to the Board through quarterly Portfolio and Risk Reports.
Implementation
IFC has made good progress implementing all the relevant measures listed in its FSF. The relevant measures, which existed at CIP approval, were adequately implemented, and reported to the Board, include IFC’s active portfolio management, balance sheet optimization, pricing policies with minimum investment return targets, and income-based designations for advisory services. In FY22, IFC also updated its capital adequacy framework and economic capital model with more granular policy ratios for economic capital allocations. In FY20, IFC reviewed its stress-testing framework from FY18.
The rating agencies provided positive assessments of IFC’s financial risk management. Moody’s Investors Service (2022b) highlighted IFC’s prudent capital risk management, robust information system, sophisticated stress testing, liquidity policies with clearly identified responsibilities, and regular reviews of financial sustainability policies. S&P Global (2022) also underscored IFC’s robust and conservative financial and risk management limits, policies, and methodologies.
IFC’s capital base was strengthened during the CIP period, demonstrating IFC’s improved financial sustainability. The increasing deployable strategic capital and decreasing capital utilization ratio, shown in figure 5.1, indicate that IFC’s financial sustainability improved. This was achieved despite lower financial return of IFC investments in recent years, as indicated by low risk-adjusted return on capital for IFC debts, internal rate of return for IFC equities, and overall net income in table 5.5. IFC’s stronger capital base can be explained by IFC’s rebalancing of its equity portfolio, its reduced private sector investments and demand for financing in client countries, and shareholders’ capital increase approval through the CIP, as reported in the latest “Financial Risk Management and Capital Adequacy” report.12 The capital increase accounted only for a four percentage point decrease of the capital utilization ratio and four percentage point increase of the deployable strategic capital in FY22, suggesting that the capital increase’s impact on IFC’s financial sustainability was relatively small and did not alleviate IFC’s constraints to expanding its financing.13 As table 5.5 indicates, the growths of IFC long-term financing commitments, including those for IDA and FCS, and outstanding investments have been slow. That said, Moody’s Investors Service and S&P Global affirmed IFC’s overall financial sustainability and presented a stable rating outlook. CIP measures certainly contributed to this (but possibly not as much as expected).
Figure 5.1. Deployable Strategic Capital and Capital Utilization Ratios of IFC

Figure 5.1. Deployable Strategic Capital and Capital Utilization Ratios of IFC
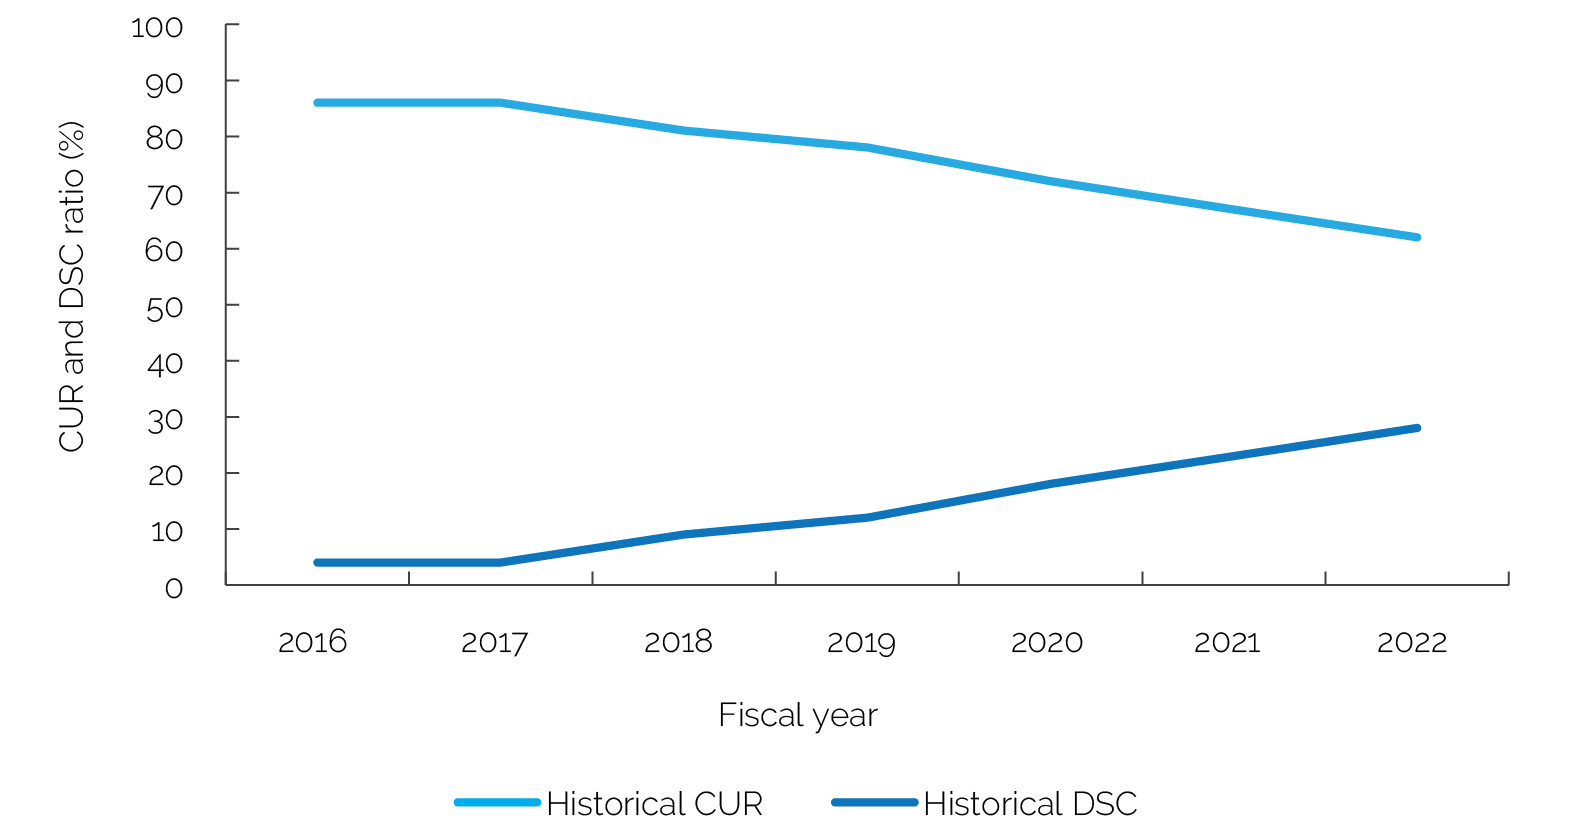
Source: Independent Evaluation Group based on data from International Finance Corporation 2022b.
Note: CUR = capital utilization ratio; DSC = deployable strategic capital; IFC = International Finance Corporation.
Table 5.5. IFC Key Financial Data
|
Key Financial Data |
FY18 (base) |
FY19 |
FY20 |
FY21 |
FY22 |
|
LTF (OA plus core mobilization; $, billions) |
23.3 |
19.1 |
22.0 |
23.3 |
23.2 |
|
LTF OA ($, billions) |
11.6 |
8.9 |
11.1 |
12.5 |
12.6 |
|
Lending to IDA FCS ($, billions) |
2.4 |
2.1 |
2.8 |
3.1 |
3.5 |
|
Mobilization ($, billions) |
11.7 |
10.2 |
10.9 |
10.8 |
10.6 |
|
STF ($, billions) |
7.4 |
5.8 |
6.5 |
8.2 |
9.7 |
|
Outstanding investment ($, billions) |
42.3 |
43.5 |
41.1 |
45.0 |
44.1 |
|
Net income ($, billions) |
1.3 |
0.1 |
(1.7) |
4.2 |
(0.5) |
|
Paid-in capital post conversion ($, millions) |
2,566 |
2,567 |
19,576 |
20,760 |
21,749 |
|
IFC debt portfolio RAROC (target 8%; %) |
7.5 |
8.2 |
6.8 |
3.2 |
4.8 |
|
IFC equity portfolio total return ~ MSCI (target > 0%; %) |
0.1 |
Negative |
−6.7 |
−6.9 |
26.2 |
|
Deployable strategic capital (%) |
9 |
12 |
18 |
23 |
28 |
|
Capital utilization ratio (%) |
81 |
78 |
72 |
67 |
62 |
Source: Independent Evaluation Group based on data from IFC 2022b, capital increase package annual reports, and IFC Strategy and Business Outlooks.
Note: FCS = fragile and conflict-affected situation; FY = fiscal year; IDA = International Development Association; IFC = International Finance Corporation; LTF = long-term financing; MSCI = Morgan Stanley Capital International; OA = own account; RAROC = risk-adjusted return on capital; STF = short-term financing.
- Instead of using the staff engagement survey, management recommended that vice presidential units launch dedicated client satisfaction surveys to gather more specific, targeted, and actionable feedback.
- Internal human resources data.
- The International Finance Corporation quarterly operations to the Board, fiscal year (FY)21, FY22, and FY23 first–second quarters (internal document).
- The International Finance Corporation management further reports that the FY19 progress of the workforce planning was limited as the International Finance Corporation absorbed the workforce planning changes, and “change fatigue” impacted staff morale (IFC 2020c).
- Because the financial package was not included in the scope of the validation, the Independent Evaluation Group did not validate the capital increase package (CIP) reporting numbers for its commitments. The validation also excludes budget efficiency commitments because Group Internal Audit is reviewing these measures.
- This information was presented by CIP’s FY21 annual report. The Independent Evaluation Group did not validate this number. The CIP expected to contribute $1.6 billion from a 10 to 40 basis point maturity premium increase for loans of more than 10 years.
- For example, the transfer to the International Development Association of $117 million in FY22 was lower than the transfer of $274 million in FY21, reflecting higher loss-provisioning requirements in FY22, according to CIP annual reports.
- World Bank management clarified that the tagging of fast-disbursing loans was only introduced in FY21, when the crisis buffer was expected to be tapped, and the Board of Executive Directors approved.
- Moody’s Investors Service annual credit analysis from February 2022 indicated that the decline in International Bank for Reconstruction and Development’s allocable income in FY21 was caused by a higher loan-loss-provisioning charge in that year compared with FY20 (Moody’s Investors Service 2022a).
- The assumptions underlying the plausible downside scenario include portfolio credit worsening, faster disbursements, slower capital payments, and the adverse impact of lower interest rates on income.
- “International Bank for Reconstruction and Development Sustainable Annual Lending Level for FY23 and Size of Crisis Buffer” (internal document). The statutory lending limit is defined in IBRD’s Articles of Agreement and stipulates that the total amount of outstanding disbursed loans, participations in loans, and callable guarantees may not exceed the total value of subscribed capital (which includes callable capital), reserves, and surplus.
- Undisclosed internal document.
- According to the Independent Evaluation Group’s calculation and based on Management’s Discussion and Analysis and Consolidated Financial Statements (IFC 2022b), the CIP contributed $1.2 billion in capital by the end of FY21 and $2.2 billion by the end of FY22. Without the CIP, the capital utilization ratio would have been 70 percent and the DSC 20 percent in FY21 and 66 percent and 24 percent in FY22.