
Results and Performance of the World Bank Group 2023
Chapter 4 | Multilateral Investment Guarantee Agency Results and Performance
Multilateral Investment Guarantee Agency (MIGA) guarantee projects in the Results and Performance of the World Bank Group cohort were exposed to, and affected by, the COVID-19 pandemic. On average, these projects were exposed to the pandemic conditions for 27 percent of their active project lives. COVID-19–related lockdowns and economic slowdowns reduced the demand for services of MIGA’s public transportation projects.
MIGA’s overall development outcome success ratings remained stable in fiscal years 2017–22, with 72 percent of guarantee projects rated satisfactory or better. However, these ratings were slightly lower over the last three years, partially reflecting the more challenging operating environment.
The reviewed MIGA guarantee projects did not have formal procedures for adjusting guarantee projects’ development objectives and outcome targets in response to crises such as COVID-19.
MIGA’s role and contribution ratings were high, with the most significant contributions in environmental and social areas and some project risk mitigation.
Half of guarantee projects in fiscal years 2017–22 had work quality shortcomings, particularly the underwriting and structuring work quality.
Local currency depreciations and cost overruns and construction delays were the two most common factors that undermined project performance.
Some MIGA guarantee projects adapted to the pandemic, showing resilience and flexibility. Capable sponsors and favorable legal and regulatory aspects helped effectively counter adverse factors.
This Results and Performance of the World Bank Group’s deep-dive analysis shows that MIGA guarantee project objectives are highly outcome oriented. However, guarantee projects achieved the outcomes defined at approval at a low rate. MIGA guarantee projects that achieved more of their intended outcomes had higher development outcome ratings.
The monitoring and evaluation of foreign investment–level outcomes is challenging; therefore, the Independent Evaluation Group and MIGA could not measure or validate some project development outcomes.
This chapter presents trends and patterns of MIGA guarantee project performance. It also describes MIGA guarantee projects’ operating environment and how potential market, or efficiency, tests can contribute to project success. The chapter also explores the development outcomes that underpin MIGA’s outcome ratings and examines key factors associated with project implementation and performance. It should be noted that only 60 projects were evaluated and validated in FY17–22 as of June 30, 2023;1 therefore, individual project ratings can make a large difference in the portfolio’s overall success rates. As such, this chapter’s results should be interpreted with caution.
Project Exposure to the COVID-19 Pandemic and Sample Selection Bias
The implementation of half of MIGA guarantee projects in the last three years was affected by COVID-19 to at least some extent. On average, these MIGA guarantee projects were exposed to the pandemic for 27 percent of their active project lives. In addition, there were delays in the delivery of some MIGA self-evaluations, which limited the number of guarantee projects analyzed in the RAP cohort.2 Delays in delivery of self-evaluations were related to client reporting delays and challenges in visiting project sites, which constrained information gathering and required more time to fill information gaps. The relatively small sample size and the fact that more self-evaluations of projects that took place during the pandemic will be completed at a later date indicate that this RAP’s analysis provides only limited and preliminary insights on the pandemic’s effects on MIGA guarantee projects.
COVID-19 exposed MIGA guarantee projects to unforeseen implementation challenges. As discussed elsewhere, the pandemic caused lockdowns, economic slowdowns, and supply chain disruptions. Lockdowns, in particular, reduced consumer needs for public transportation and fuel products, thereby diminishing the demand for some of MIGA’s Infrastructure guarantee projects. Some hospital projects in the Agribusiness and General Services sector also experienced reduced demand for elective health care services, which were considered nonessential during the pandemic.
As with IFC investment projects, MIGA also has no formal procedures for changing its guarantee project–related objectives or targets when confronted with crises. MIGA-guaranteed private sector projects must be efficient and competitive to be commercially viable while simultaneously delivering development outcomes. In other words, MIGA guarantee projects must deliver the double bottom line of achieving financial sustainability and development impact. Moreover, all MIGA guarantee projects are required to comply with MIGA’s environmental and social performance standards, thereby achieving a triple bottom line. MIGA guarantee projects can adapt to changing market conditions, such as those caused by the COVID-19 pandemic. However, the existing framework does not include the adjustment of such originally envisioned development objectives and targets, considering ex post changed market conditions, such as those caused by the COVID-19 pandemic. According to MIGA, the current Impact Measurement and Project Assessment Comparison Tool (IMPACT) framework allows an adjustment of the expected impact claims when processing contract modifications. However, IEG has not yet evaluated any projects with IMPACT-tracked development objectives.
Project Performance Rating Trends
Development outcome success ratings of MIGA guarantee projects remained stable. On a six-year rolling basis, 72 percent of MIGA guarantee projects in FY17–22 were rated satisfactory or better, the same level as in FY16–21 (figure 4.1). The composition of granular project development outcome ratings in FY17–22 remained largely the same as in FY16–21. That said, these development outcome success rates were slightly lower over the last three years because of a more challenging operating environment. A larger share of negatively rated projects in FY20–22 offset higher-performing projects in FY17–19 (see appendix H, figure H.2).
Figure 4.1. MIGA Guarantee Project Development Outcome Ratings

Figure 4.1. MIGA Guarantee Project Development Outcome Ratings

Source: Independent Evaluation Group.
Note: The Multilateral Investment Guarantee Agency Project Evaluation Report guidelines were changed in FY19, replacing a four-point scale for development outcome ratings with a six-point one. The six-point rating scale, applied to projects starting in FY20, was converted to a four-point one as follows: highly successful = excellent; successful and mostly successful = satisfactory; mostly unsuccessful = partly unsatisfactory; and highly unsuccessful and unsuccessful = unsatisfactory. FY = fiscal year; MIGA = Multilateral Investment Guarantee Agency; PER = Project Evaluation Report; S+ = satisfactory or better.
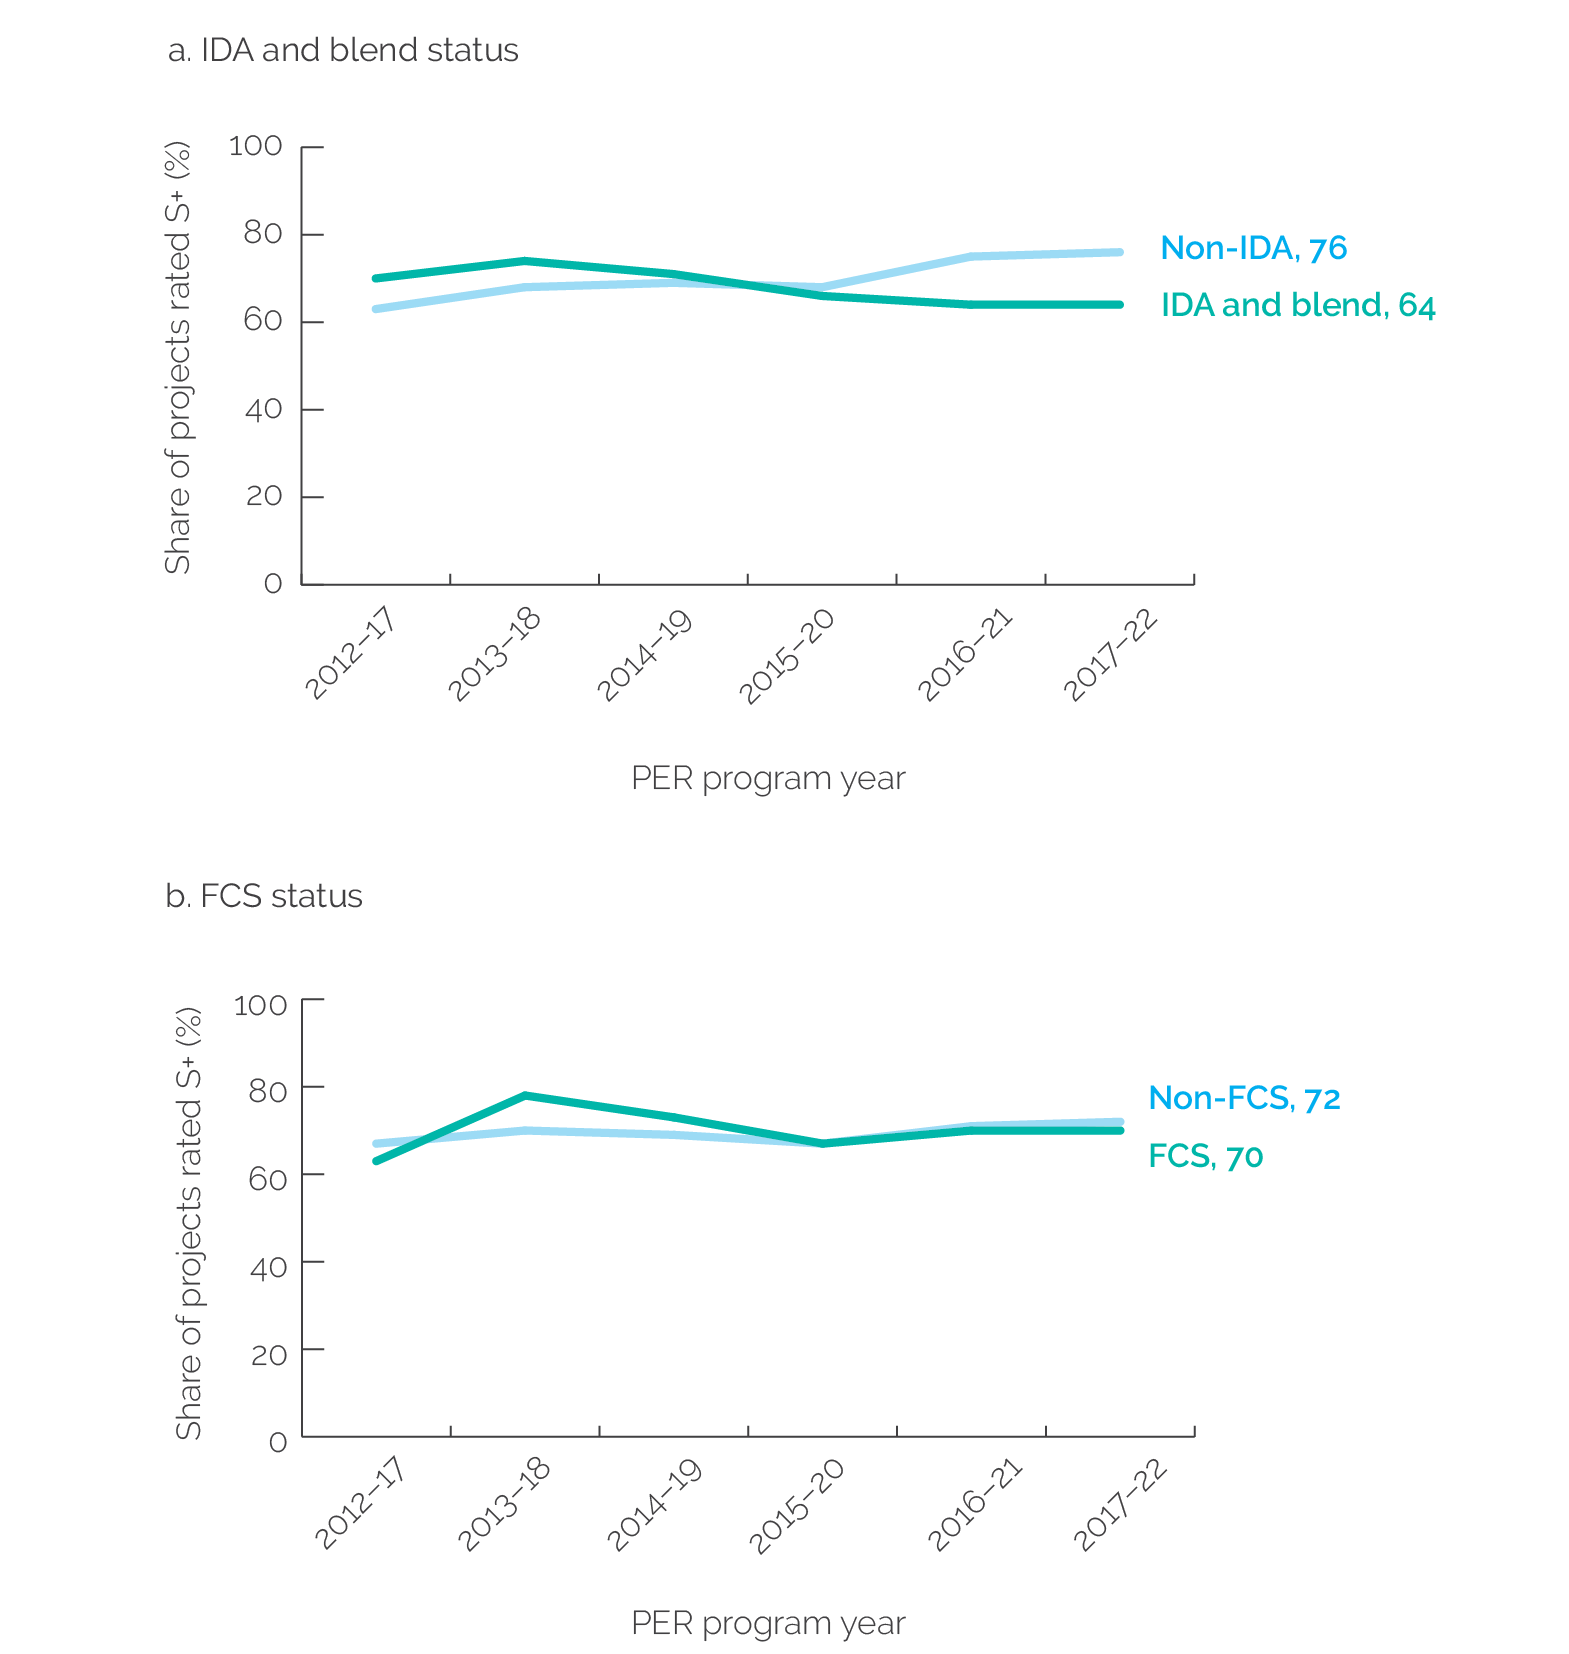
The performance gap between MIGA guarantee projects in IDA and blend countries and those in non-IDA countries largely stayed the same during FY17–22. MIGA’s overall development outcome ratings of guarantee projects in both IDA and blend and non-IDA countries remained stable (figure 4.2, panel a). However, the performance of IDA and blend projects, representing 37 percent of MIGA’s evaluated portfolio, continued to be lower than that of non-IDA projects, with 64 percent rated satisfactory or better for development outcome in FY17–22. In contrast, guarantee projects in non-IDA countries, representing 63 percent of MIGA’s evaluated portfolio, maintained satisfactory or better ratings for 76 percent of projects in FY17–22. This is important because MIGA’s FY21–23 strategy priority is to deepen its commitment to IDA and blend countries. Indeed, the share of MIGA’s overall portfolio operating in these countries has significantly increased from 24 percent in FY19 to 65 percent in FY22. The evaluated portfolio of MIGA guarantee projects in FCS countries was generally small, with 10 or fewer projects per period. That said, the percentage of those rated satisfactory or better for overall development outcome remained stable at 70 percent between FY16–21 and FY17–22 (figure 4.2, panel b). This performance in FCS countries was on par with performance in non-FCS projects.
Figure 4.2. MIGA Guarantee Project Development Outcome Success Ratings, by IDA and Blend and FCS Status

Figure 4.2. MIGA Guarantee Project Development Outcome Success Ratings, by IDA and Blend and FCS Status
Source: Independent Evaluation Group.
Note: FCS = fragile and conflict-affected situation; IDA = International Development Association; MIGA = Multilateral Investment Guarantee Agency; PER = Project Evaluation Report; S+ = satisfactory or better.
As with IFC investment projects, MIGA guarantee projects have many market-related hurdles to overcome to be successful. As an insurer, MIGA guarantees a sponsor’s investment, but it is the sponsor, not MIGA, that deals directly with the project enterprise. Therefore, MIGA is one step removed from the project, limiting its influence over project design, structuring, and implementation. By contrast, MIGA stays closely involved in a project’s environmental and social areas and its risk reduction. In IDA and FCS countries, MIGA is constrained by the limited capacity and experience of available sponsors. Moreover, the fact that project sponsors seek MIGA’s political risk guarantees suggests that political risk is another challenge in these countries. These risks make sponsors reluctant to invest without MIGA guarantees.
MIGA achieved high success rates in carrying out its expected role and contribution. The share of guarantee projects with satisfactory ratings for MIGA role and contribution was 88 percent in FY17–22, the same level as in FY16–21 (figure 4.3). In fact, MIGA’s role and contribution ratings were generally high across the entire portfolio. For example, MIGA achieved its expected role and contribution in 80 percent of guarantee projects in FCS countries. Moreover, MIGA’s role and contribution ratings in IDA and blend countries were on par with those same ratings in non-IDA countries. MIGA’s role and contribution was most significant in environmental and social areas and risk reduction.
Figure 4.3. MIGA Work Quality and Role and Contribution Success Ratings

Figure 4.3. MIGA Work Quality and Role and Contribution Success Ratings

Source: Independent Evaluation Group.
Note: MIGA = Multilateral Investment Guarantee Agency; PER = Project Evaluation Report; S+ = satisfactory or better.
Half of MIGA guarantee projects in FY17–22 continued to have work quality shortcomings. Sixty percent of MIGA guarantee projects for the six-year rolling average over FY12–17 were rated satisfactory or better, but the share fell to 51 percent in FY16–21 and to 50 percent in FY17–22 (see figure 4.3). The decline was even more evident when looking at three-year rolling averages, falling from 56 percent rated satisfactory or better in FY15–17 to 48 percent in FY19–21 and just 43 percent in FY20–22. MIGA work quality rating was correlated with the development outcome rating in 75 percent of guarantee projects in FY17–22. Twenty-seven percent of these cases had low development outcomes, which were associated with MIGA’s weak work quality.
Factors Affecting Project Implementation and Performance
Several factors besides COVID-19 negatively affected the performance of recent MIGA guarantee projects. As with IFC, this RAP conducted a deep-dive analysis of 16 MIGA guarantee projects validated from FY20 to FY22 and identified the top factors affecting the guarantee project performance.3 These factors could have either a negative or positive influence on project performance (see appendix A for the definitions of different factors). Ten of the 16 projects had high development outcome ratings, and 6 projects had low development outcome ratings. Cost overruns and construction delays and unfavorable foreign exchange rates were the two most common adverse factors, with each affecting 25 percent of the analyzed projects. Cost overruns and construction delays undermined the financial and economic performance of 4 projects in the energy, public transportation, and extractive industry sectors. Foreign exchange factors undermined the financial results of 4 MIGA guarantee projects in the health sector. Another factor—increased competition—negatively affected 3 projects, or 19 percent, in the energy and telecom sectors by weakening their operational and financial results. Inadequate M&E prevented 3 Infrastructure projects from verifying some of their intended development impacts. MIGA guarantee projects were also challenged by other factors to a lesser extent, including adverse economic issues, increased political risk, inadequate market assessments, and the low technical expertise and track record of sponsors and project enterprise management.
Some MIGA guarantee projects adapted to the pandemic. For example, MIGA hospital projects in the Agribusiness and General Services sector adapted to the pandemic by assisting the government’s response to the pandemic’s emerging medical demands. The projects offered COVID-19 treatment, which increased demand for these projects’ operations.
Several factors positively influenced MIGA guarantee project success, particularly strong sponsor technical expertise and favorable legal and regulatory factors. These two factors influenced 31 percent of projects in the MIGA RAP cohort, especially the four health sector projects. These greenfield hospital public-private partnership (PPP) projects benefited from having sponsors with financial capacity, competent management, and relevant experience in implementing PPP projects. The payment mechanism in these PPP projects protected sponsors from the downside risk of a local currency depreciation. It was also the strong technical expertise and track record of sponsors and project enterprise management along with favorable legal and regulatory factors that separated mostly successful projects from mostly unsuccessful projects. These two mitigating factors enabled these mostly successful projects to cope with the pandemic and other crises and achieve largely positive results. Other factors aiding MIGA’s project performance in FY20–22, but to a lesser extent, were as follows: (i) a high market share for the project enterprise’s business (13 percent), (ii) favorable business aspects (13 percent), (iii) positive environmental and social aspects (13 percent), and (iv) savings in project costs and construction times (13 percent). See box 4.1 for examples of how these factors affected project performance across sectors.
Box 4.1. Examples of Supporting and Constraining Factors Affecting MIGA Guarantee Project Performance, by Sector
Finance and Capital Markets Projects
Supporting factors. Positive technical expertise and track record meant that the financial institution management was strong and the financial institution had a strong performance in terms of total loan growth, earnings, capital adequacy, and liquidity. Market share meant that the financial institution was the leader in the small and medium enterprise lending market, which gave it an edge over the competition.
Constraining factors. Weak earnings and profitability meant that the financial institution had weaker-than-expected loan growth and financial performance, including deteriorated asset quality, lower profitability, and tighter liquidity. Inadequate market assessment meant that MIGA did not adequately assess the financial institution’s commitment and capacity to achieve the project’s intended objectives, given that the ultimate beneficiaries of the MIGA-supported financing were not realized as expected, thus reducing the development impact.
Infrastructure and Energy and Extractive Industries Projects
Supporting factors. Positive project cost and construction times meant that the project construction was under budget and that implementation was on time.
Constraining factors. Adverse competition meant that the project enterprise experienced a highly competitive market that depressed revenues, suffered from overcapacity in the sector, or faced competition from more efficient new entrants in the market. Cost overruns and construction delays meant that the project suffered from implementation delays and cost overruns, which negatively affected the project’s financial and economic returns. Monitoring and evaluation issues meant that the project had shortcomings in monitoring and evaluation, such as the lack of quantified baseline or targets and information on actual results, preventing the verification of achievement of its intended development impacts.
Agribusiness and General Services Projects
Supporting factors. The high technical expertise and track record meant that the sponsors had financial capacity, relevant experience in implementing public-private partnership projects, and competent management that ensured high-quality operations and maintenance. The positive legal and regulatory factors meant that the payment mechanism in public-private partnership projects protected the sponsors from the downside risk of a depreciation of the local currency.
Constraining factors. The adverse foreign exchange and local currency factors meant that depreciation of the local currency and resulting foreign exchange losses negatively affected financial results of the project enterprises.
Source: Independent Evaluation Group.
Note: MIGA = Multilateral Investment Guarantee Agency.
Similar to IFC, the deep-dive analysis found that performance factors affecting MIGA guarantee projects could be divided into those within the control of MIGA, its sponsor, or the project enterprise, and those outside of their control. For example, economic issues, the COVID-19 pandemic, and legal and regulatory changes were not foreseeable and could be considered outside of the control of MIGA, the sponsor, or the project enterprise. However, other factors could be considered within their control and thus could have been mitigated. Among these factors, the technical expertise of sponsors, market assessment, and M&E could be considered within their control. See table 4.1 for examples of potential measures that could mitigate adverse performance factors.
Table 4.1. Examples of Potential Mitigation Measures for MIGA Guarantee Projects, by Sector
|
Adverse Performance Factor |
Potential Mitigation Measures |
|
Finance and Capital Markets Projects |
|
|
Inadequate market assessment: Refers to the inadequate assessment of a financial institution’s commitment and capacity to achieve the project’s intended objectives. In such cases, the beneficiaries of the financing are not supported as expected, reducing development impact. |
Mitigant: Better define development impact objectives at appraisal by clarifying the purpose and use of proceeds of guaranteed facilities and establishing appropriate development impact indicators. |
|
Infrastructure and Energy and Extractive Industries Projects |
|
|
Monitoring and evaluation: Refers to the project having shortcomings in monitoring and evaluation, such as the lack of quantified baseline or targets and information on actual results, preventing the verification of achievement of its intended development impacts. |
Mitigant: Establish appropriate mechanisms for development impact data gathering in guarantee projects, where the project enterprise is not a direct signatory to supported financing agreements. |
|
Agribusiness and General Services Projects |
|
|
Foreign exchange and local currency: Refers to depreciation of the local currency that results in foreign exchange losses that negatively affect the financial results of the project enterprise. |
Mitigant: Identify and assess the potential impact of foreseeable macroeconomic developments, including depreciation of the local currency, that may increase the size of the government’s financial obligations and assess whether the government will be willing and have the capacity to pay the increased obligations. |
Source: Independent Evaluation Group.
Note: MIGA = Multilateral Investment Guarantee Agency.
Outcome Types of Multilateral Investment Guarantee Agency Guarantee Projects
This RAP continued the RAP 2021 outcome type analysis and found that MIGA project objectives were highly outcome oriented. The deep-dive analysis looked at 78 outcomes within 13 outcome types, in 16 MIGA guarantee projects validated from FY20 to FY22 (see appendix A for the outcome typology). MIGA guarantee project outcomes fall into two broad categories: project-level outcomes and foreign investment–level outcomes. Of the 78 outcomes, 62 were intended project-level outcomes and 16 were intended foreign investment–level outcomes. Reviewed projects established, on average, 5 outcome types per project—this usually included 4 project-level outcomes and 1 foreign investment–level outcome. Overall, all projects pursued project-level outcomes, and 81 percent pursued at least 1 foreign investment–level outcome. This confirms the RAP 2023 Concept Note’s hypothesis that MIGA guarantee projects were outcome oriented or were focused on higher-level outcomes, such as foreign investment–level outcomes beyond the project level. These outcome types reflected MIGA’s focus on larger infrastructure projects for the health care, energy, telecommunications, and transportation sectors in FY20–22. The most prevalent foreign investment–level outcome was market development, found in 56 percent of projects. For project-level outcomes, all MIGA guarantee projects included improved access to goods and services. Other prevalent project-level outcomes included increased employment and quality and affordability of goods and services, which were present in 63 percent and 50 percent of projects, respectively.
MIGA’s outcome achievement rates were relatively low. Of the 78 outcomes defined at approval, MIGA guarantee projects fully achieved 50 percent and partially achieved 22 percent. Of the 62 project-level outcomes defined at approval, projects fully achieved 55 percent and partially achieved 21 percent (table 4.2). Of the 16 foreign investment–level outcomes, projects fully achieved 31 percent and partially achieved 25 percent. This shows that MIGA guarantee projects had a higher probability of achieving project-level outcomes than foreign investment–level outcomes, thereby confirming the RAP 2023 hypothesis and RAP 2021 findings that foreign investment–level outcomes are more challenging to achieve.
Table 4.2. MIGA Outcome Type Performance: Achievement Rate
|
Outcome Type |
Outcomes (no.) |
Outcome Achieved (fully; %) |
Outcome Achieved (partially; %) |
Outcome Achieved (fully + partially; %) |
|
Project-level outcomes |
||||
|
1.1 - Access to goods and services |
19 |
63 |
11 |
74 |
|
1.1.1 - Access to goods and services (MSME) |
1 |
0 |
0 |
0 |
|
1.1.2 - Access to goods and services (female) |
0 |
n.a. |
n.a. |
n.a. |
|
1.1.3 - Access to goods and services (customers) |
4 |
100 |
0 |
100 |
|
1.1.4 - Access to goods and services (miscellaneous) |
14 |
57 |
14 |
71 |
|
1.2 - Quality and affordability of goods and services |
10 |
80 |
10 |
90 |
|
1.4 - Improved living standards (earnings) of individuals |
2 |
0 |
50 |
50 |
|
1.6 - Economic return |
1 |
0 |
0 |
0 |
|
3.1 - Increased employment |
10 |
60 |
40 |
100 |
|
3.2 - Improved capacity and skills |
1 |
100 |
0 |
100 |
|
4.1 - Increased transfers to the government |
6 |
17 |
67 |
84 |
|
6.2 - Greenhouse gas reduction |
6 |
33 |
0 |
33 |
|
6.3 - Efficient use of resources |
3 |
67 |
33 |
100 |
|
7.2 - Induced or indirect employment |
1 |
100 |
0 |
100 |
|
7.3 - Export sales |
2 |
50 |
0 |
50 |
|
8.1 – Governance |
1 |
0 |
0 |
0 |
|
Total project-level outcomes |
62 |
55 |
21 |
76 |
|
Foreign investment–level outcomes |
||||
|
9 - Business and sector practices |
4 |
0 |
0 |
0 |
|
10 - Market development |
9 |
33 |
44 |
77 |
|
11 - Development reach |
1 |
0 |
0 |
0 |
|
12 - Sustainability |
0 |
n.a. |
n.a. |
n.a. |
|
13 - Signaling effects |
2 |
100 |
0 |
100 |
|
Total foreign investment–level outcomes |
16 |
31 |
25 |
56 |
|
Total outcomes |
78 |
50 |
22 |
72 |
Source: Independent Evaluation Group.
Note: Of the total project-level outcomes, 10 percent were considered not achieved because the results could not be verified. Of the total foreign investment–level outcomes, 13 percent were considered not achieved because their results could not be verified. MIGA = Multilateral Investment Guarantee Agency; MSME = micro, small, and medium enterprise; n.a. = not applicable.
Monitoring and evaluation shortcomings prevented the validation of some development outcomes and may have depressed development outcome ratings. Of the 78 outcomes examined in the deep dive, 28 percent were not achieved either fully or partially, including 24 percent of project-level outcomes and 44 percent of foreign investment–level outcomes. Moreover, the Development Effectiveness Indicator System did not track 69 percent of outcomes. In many cases, MIGA or IEG used other information sources to validate the outcome claim. However, 10 percent of project-level outcomes and 13 percent of foreign investment–level outcomes could not be verified by MIGA or IEG at all because of a lack of evidence, confirming the RAP 2023 Concept Note’s hypothesis that foreign investment–level outcomes are more challenging to measure than project-level outcomes.
Relationship between Outcomes and Project Performance Ratings
The RAP deep-dive analysis showed that projects that achieved more of their expected outcomes achieved higher development outcomes ratings. According to Project Evaluation Report guidelines, the development outcome ratings of MIGA guarantee projects are assigned at the project level and subdimension level and not at the outcome level. Therefore, this RAP expanded the outcome type analysis conducted by RAP 2021 by examining the relationship between project outcomes and development outcome ratings. It generally found that projects with higher levels of outcome achievement had higher development outcome ratings. Projects with a successful development outcome rating achieved 80 percent of their outcomes, whereas projects with an unsuccessful rating achieved only 22 percent of their outcomes (table 4.3). A project’s achievement of foreign investment–level outcomes was not as much of a determining factor for development outcome ratings’ success, but this could be because of the very small sample size. Nevertheless, successful projects achieved 50 percent of their foreign investment–level outcomes, whereas unsuccessful projects achieved none of their foreign investment–level outcomes. Outcome achievement was also the main difference between borderline projects, with mostly successful projects achieving 69 percent of their outcomes but mostly unsuccessful projects only achieving 45 percent.
Table 4.3. MIGA Guarantee Project Development Outcome Ratings and Underlying Outcome Achievement Rates
|
Development Outcome Rating |
Projects (no.) |
Outcomes (no.) |
Overall Outcome Weighted Achievement Rate (%) |
Project-Level Outcome Weighted Achievement Rate (%) |
Foreign Investment–Level Outcome Weighted Achievement Rate (%) |
Project Business Performance Average Rating |
Environmental and Social Effects Average Rating |
|
Successful |
5 |
25 |
80 |
89 |
50 |
3.0 |
3.0 |
|
Mostly successful |
5 |
24 |
69 |
79 |
43 |
2.4 |
3.2 |
|
Mostly unsuccessful |
4 |
20 |
45 |
44 |
50 |
2.0 |
2.8 |
|
Unsuccessful |
2 |
9 |
22 |
25 |
0 |
1.0 |
3.0 |
Source: Independent Evaluation Group.
Note: Achievement rates at the project level are measured by efficacy of outcome achievements in projects, with the following weights: outcome achieved = 1, partly achieved = 0.5, not achieved = 0, and cannot verify = 0. Project business performance and environmental and social effects ratings’ numerical values are as follows: excellent = 4, satisfactory = 3, partly unsatisfactory = 2, and unsatisfactory = 1. MIGA = Multilateral Investment Guarantee Agency.