
An Evaluation of International Finance Corporation Investments in K–12 Private Schools
Chapter 2 | IFC Involvement in K–12 Private Schools: An Overview of the Strategies and Portfolio
IFC Strategies and Business Models for K–12 Schools
Although it operated under multiple strategies during its 22 years of exploration, IFC has not explicitly stated its overall objectives for K–12 education. The IFC portfolio in K–12 private schools has roots in the small and medium enterprise (SME) work of the mid-1990s. Its investments in K–12 private schools subsequently evolved along with its education strategy but remained small and exploratory in nature. The range of financing instruments used and the types of schools financed since the mid-1990s suggest that IFC attempted to engage with different scales and types of institutions and contexts, although it is not clear that this was intentional.
Strategies
IFC’s institutional mandates in education are linked to those of the Bank Group. All institutions of the Bank Group operate under major international agreements on education: World Declaration on Education for All (1990), Millennium Development Goals (2000–15, Goal 2), and SDGs (2016–ongoing, SDG 4). In all cases, the central theme is that a quality basic education is a right—an essential public good—and should be accessible for all. SDG 4 goes further in seeking to ensure that by 2030, “all girls and boys complete free, equitable and quality primary and secondary education leading to relevant and effective learning outcomes.”1 IFC’s activities are also part of the Bank Group corporate mission and country-specific strategies, which encompass the work of the World Bank, IFC, and Multilateral Investment Guarantee Agency. Although this evaluation did not examine specific country strategies, IEG has found that in the education field, Bank Group country strategies may envision support for improvement to the regulatory and institutional environments and support for public schools (including public-private partnerships). Such support is provided by the World Bank and rarely includes planned investment in private K–12 or early childhood education provided by IFC.
IFC investments in the education sector (including in K–12 private schools) have been guided by a series of strategies endorsed by the IFC Board of Directors since 1999. Those strategies have focused more on technical and vocational education and training and tertiary education than on K–12 education.2 The strategies consistently strike several thematic notes: the importance of education to economic development and job creation, underperformance of public school systems and demand-side pressure from middle-class parents for private schools, the relative difficulty of finding investment opportunities in K–12 education (including private schools), an increased focus on access and education quality, and repeated and increasing emphasis on the need to collaborate and coordinate with the World Bank and other stakeholders. The strategies offer little guidance for how IFC should operate in the complex environment of countries’ school systems that include public and private K–12 schools. As previously noted, the strategies also do not provide a theory of change to support IFC’s investments in K–12 private schools. Figure 2.1 provides an overview of IFC’s involvement in K–12 private education linked to the evolution of IFC and Bank Group education strategies and of global development goals on education.
The difficult investment environment has led other DFIs to make significant changes in their approach to the K–12 subsector in recent years. As previously noted, IFC stopped new investments in K–12 private schools in 2017 for lack of viable investment opportunities and weak financial results from its existing investments. Nonetheless, the subsector was mentioned in IFC’s 2018 education sector deep dive, which focused on creating markets for private provision and solutions in early childhood education and basic education. IFC’s plan to create those markets entails supporting public-private partnership frameworks and regulations and investing in private companies offering business-to-government and business-to-business solutions. The
Figure 2.1. Timeline of IFC Strategy and Engagement in the K–12 Education Subsector
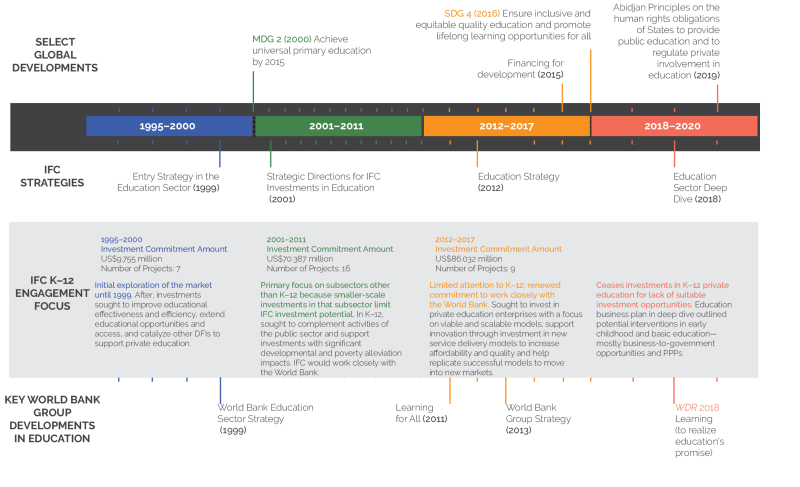
Figure 2.1. Timeline of IFC Strategy and Engagement in the K–12 Education Subsector
Sources: International Finance Corporation education sector strategies from 1999 to 2018. IFC management information system reserve database, for the investment amounts and number of projects.
Note: Investment commitment amounts and number of projects refer to IFC direct investments only. DFI = development finance institution; FY = fiscal year; IFC = International Finance Corporation; K–12 = kindergarten through grade 12; MDG = Millennium Development Goal; PPP = public-private partnership; SDG = Sustainable Development Goal; WDR = World Development Report.
2018 strategy held open the possibility of direct investment in viable and scalable early childhood education and K–12 (or basic) education. Several other DFIs (such as the United Kingdom’s Department for International Development [replaced by the Foreign, Commonwealth & Development Office], the United States Agency for International Development, and the Swiss Agency for Development and Cooperation) have recently established frameworks for financing K–12 private education to overcome the challenges of investing in the K–12 subsector and address some of the criticisms about the potential of private education to aggravate learning inequalities (detailed in chapter 3).
Portfolio Profile and Evolution
Portfolio Profile
IFC’s portfolio in K–12 private schools was small and employed a variety of instruments. The portfolio consisted of 25 direct investments and 27 indirect investments through Funds (see box 1.1 for descriptions of these investment types). In addition, the amounts committed and the share of IFC investment in the total cost were generally low (tables 2.1 and 2.2). The 25 direct investments accounted for $156.5 million in commitments—21 percent of all IFC education projects and less than 10 percent of its education sector commitments.
In addition to its direct financing, IFC had indirect equity participation in 27 Funds with K–12 private school investments. As of February 2021, IFC had invested in 21 Funds that in turn had 27 investments in 26 K–12 private schools,3 mostly located in Sub-Saharan Africa. The net asset value of these investments was estimated at nearly $150 million, with IFC’s share being about 14 percent of the total. Seventeen Funds were still actively invested in 20 K–12 private schools as of February 2021; six Funds had exited from the subsector. Three of the K–12 investee companies were also direct recipients of IFC loans.
Table 2.1. Breakdown of IFC Investments by Instrument Type for Direct Investments
|
IFC Investment Instruments |
Modality |
Investment Projects (no.) |
IFC Commitment Amount (US$, millions) |
Project Size (US$, millions) |
Share of IFC Investment to Overall Project Cost (%) |
Examples |
|
(1) Loans |
17 |
84.90 |
163.4 |
49.2 |
||
|
Straight senior loans |
SME facility |
2 |
0.68 |
1.9 |
36.0 |
Cameroon, Uganda |
|
Direct loans |
14 |
79.70 |
161.5 |
49.3 |
Indonesia, Kenya, Lebanon, Mexico, Nigeria, South Africa, Tanzania, Uganda, and an East Asia and Pacific regionwide project |
|
|
Syndicated loan |
1 |
4.5 |
10.0 |
45.0 |
Turkey |
|
|
(2) Straight equity investments |
2 |
25.5 |
65.5 |
38.9 |
China, Kenya |
|
|
(3) Quasi-equity investments (C loans) |
2 |
37.0 |
73.0 |
50.7 |
Egypt, Arab Rep. and a Middle East and North Africa regionwide project |
|
|
(4) Risk-Sharing Facility (first-loss guarantee facility) |
4 |
9.1 |
21.0 |
43.4 |
Ghana, Kenya, Rwanda |
|
|
Total |
25 |
156.5 |
322.9 |
48.5 |
Source: Independent Evaluation Group.
Note: IFC’s first investment in K–12 private schools between 1995 and 2000; IFC used two SME lending facilities to provide loans to four of the five K–12 private schools during this period. Refer to box 1.1 for a description of IFC instruments used in financing K–12 private schools. IFC = International Finance Corporation; K–12 = kindergarten through grade 12; SME = small and medium enterprise.
Table 2.2. Breakdown of IFC Investments by Instrument Type for Indirect Investments
|
IFC Investment Instruments |
Funds Investment in K–12 Schools (no.) |
IFC’s Share of Net Asset Value (US$, millions) |
Total Net Asset Value (US$, millions) |
Share of IFC to Total Net Asset Value (%) |
Examples |
|
(5) Equity investments through IFC investments in Funds |
27 |
20.5 |
146.9 |
14.0 |
Cambodia; Colombia; Congo, Dem. Rep.; Ghana; Jordan; Kenya; Kyrgyz Republic; Morocco; Myanmar; Turkey; Vietnam; and two regionwide projects (Middle East and North Africa Region and World region) |
Source: Independent Evaluation Group.
Note: Indirect investment data are as of February 1, 2021. IFC = International Finance Corporation; K–12 = kindergarten through grade 12.
The evaluation focuses mainly on IFC direct investments; IFC indirect investments through Funds were not assessed in-depth because the operational details of the K–12 private school investee companies are not documented, and IFC does not monitor their development outcomes.4 Such practices are typical of many Funds, although impact investment and venture capital Funds will report on indicators such as enrollment numbers. These practices are also common among all DFIs that have provided financing to private equity, venture capital, or impact investment funds that in turn invested in K–12 private schools (refer to appendix F for more information). The Funds also typically include investments in multiple other sectors, with reporting aggregated in a manner that does not allow for assessment of the performance of individual investments. This lack of more detailed information on the fund investments in K–12 schools makes it impossible to evaluate their learning outcomes or even assess any element of education access, quality, or financial sustainability. For that reason, the main focus of the evaluation is on the 25 direct investments.
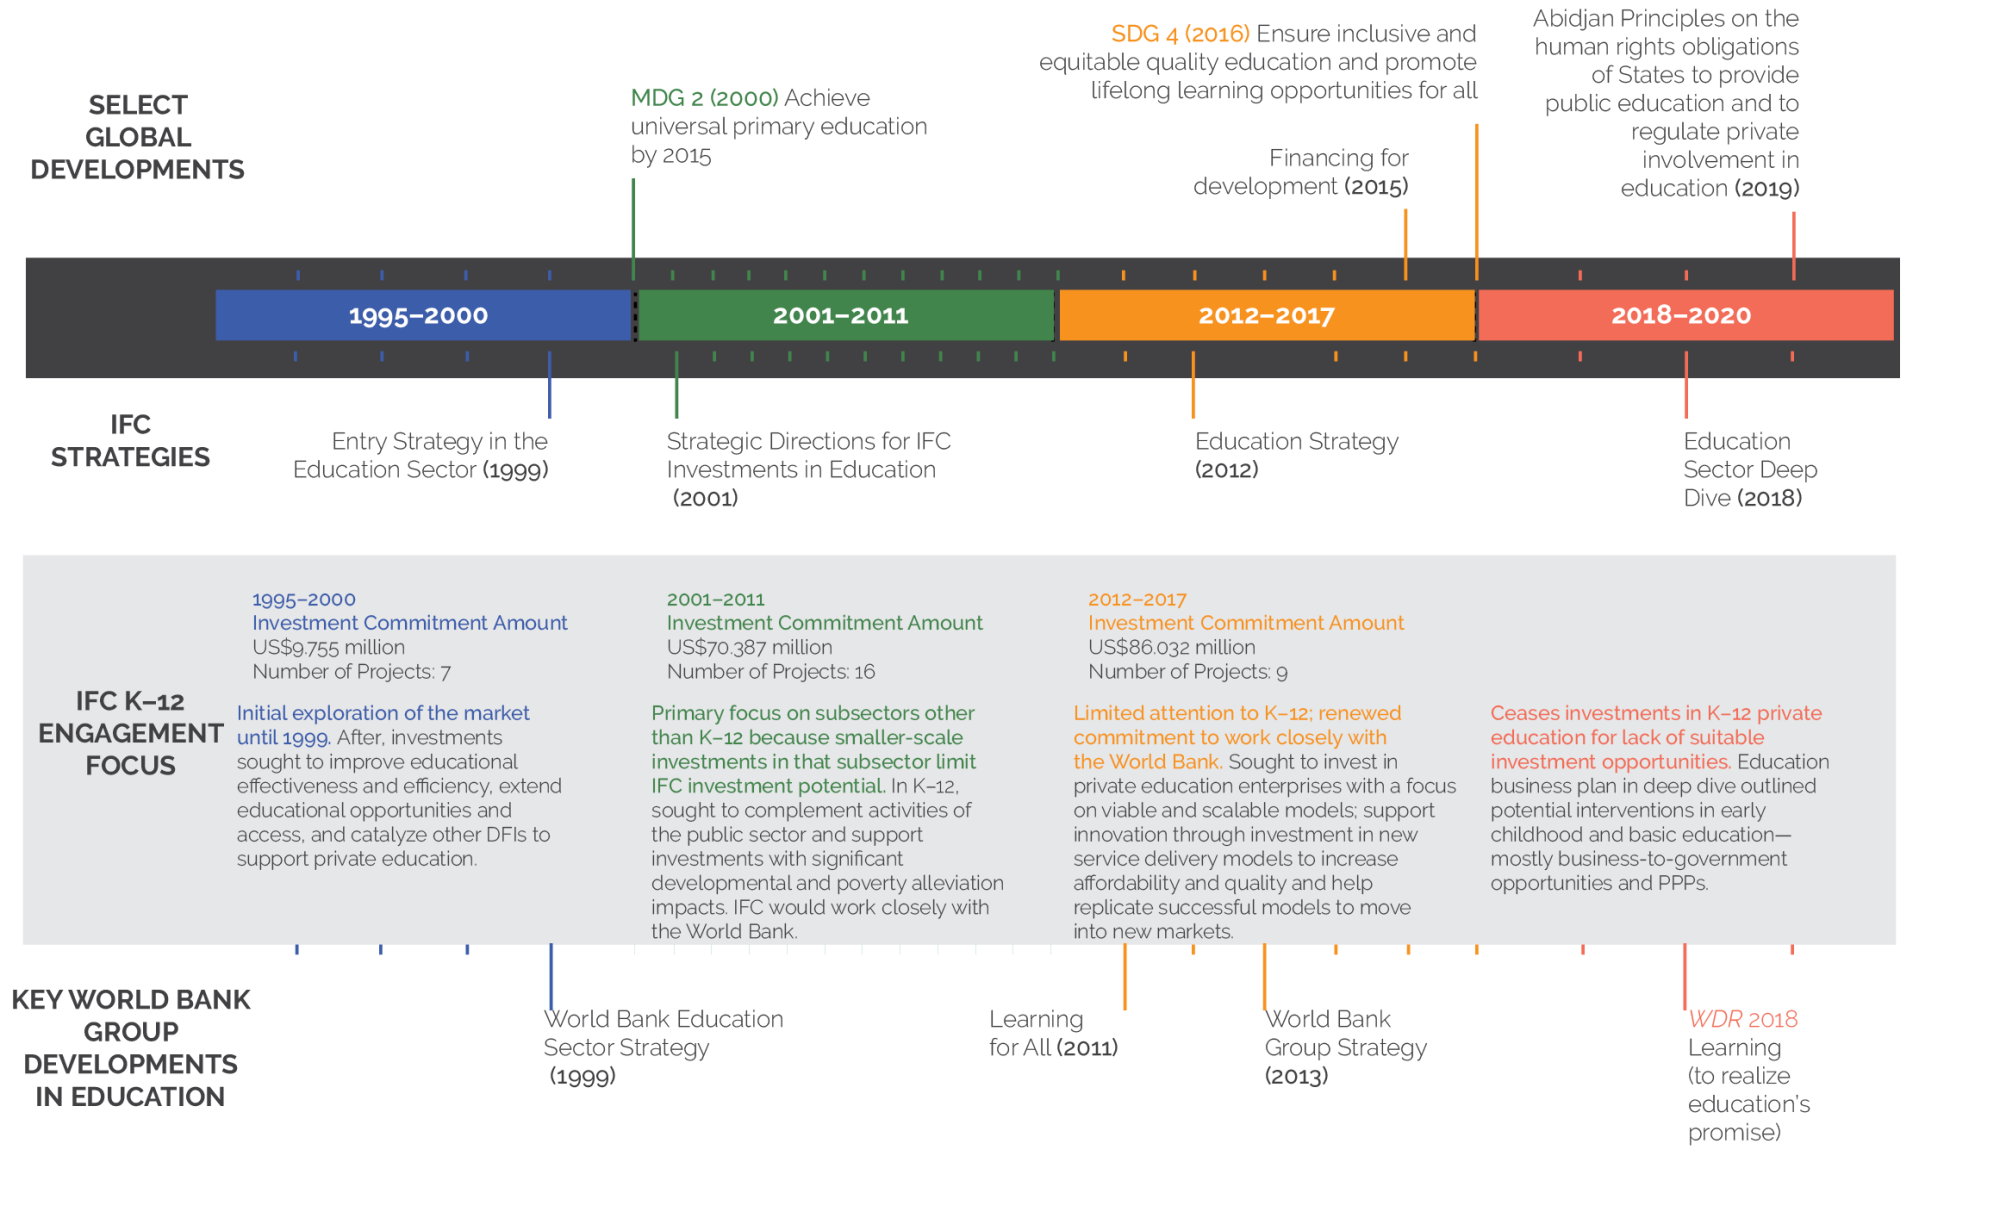
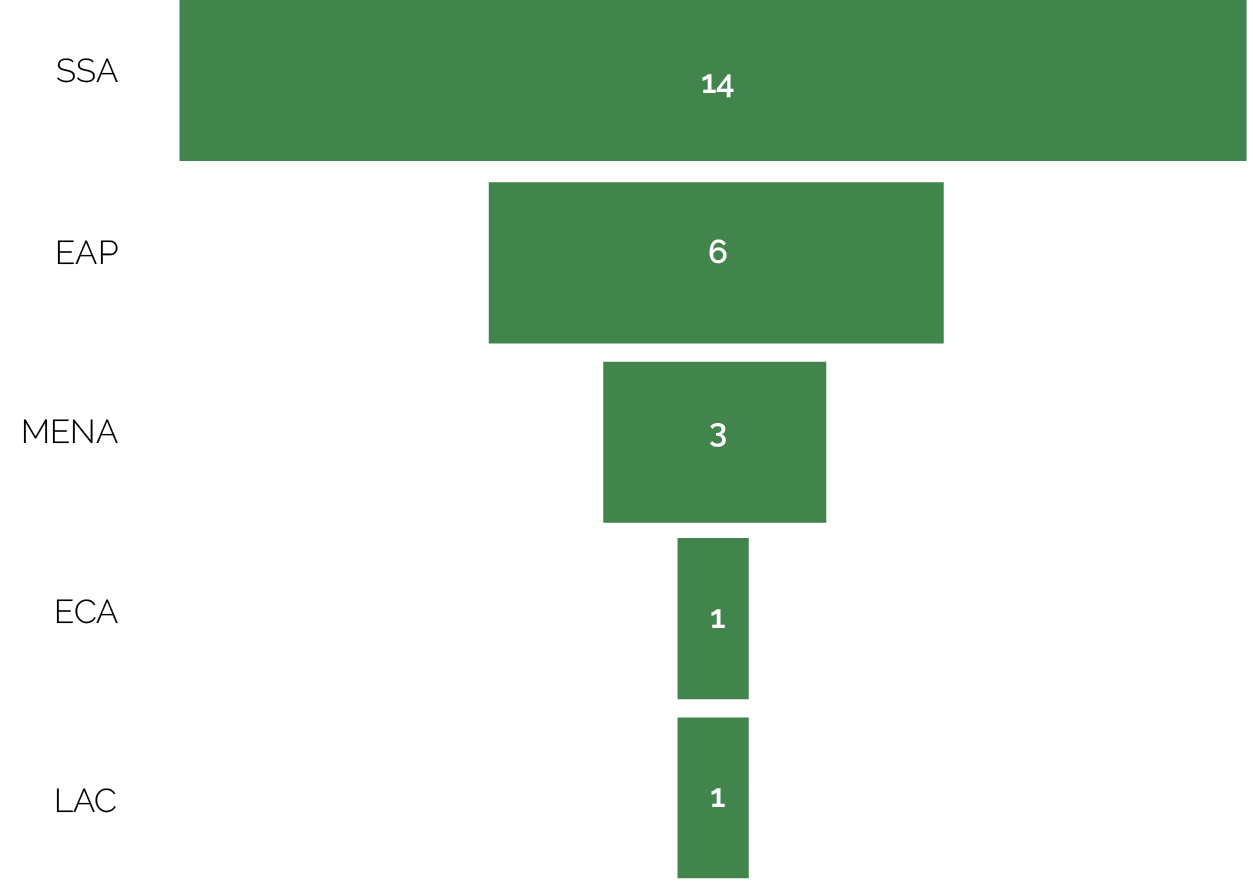
The 25 direct investments were distributed across all regions, although unevenly (figures 2.2 and 2.3).5 Sub-Saharan Africa accounted for the largest number of investment projects, with Kenya accounting for the largest number of projects; however, the average of IFC’s original commitments was highest in the Middle East and North Africa Region ($15 million per investment), followed by the East Asia and Pacific Region ($8.8 million per investment). The average commitment in Sub-Saharan Africa was just $3.4 million per project at appraisal. In Middle East and North Africa and in East Asia and Pacific, IFC focused on middle-income countries. The number of projects is almost evenly distributed among International Development Association (IDA) and non-IDA countries (using country income classification at the time of project approval). By commitment amounts, 75 percent of IFC investments in K–12 private schools were to schools in non-IDA (or middle-income) countries.

Source: International Finance Corporation management information system reserve database.
Note: EAP = East Asia and Pacific; ECA = Europe and Central Asia; LAC = Latin America and the Caribbean; MENA = Middle East and North Africa; SSA = Sub-Saharan Africa.
Figure 2.3. Amount of IFC Direct Investments in K–12 Private Schools, 2001–17, by Region (original commitment; US$, millions)

Figure 2.3. Amount of IFC Direct Investments in K–12 Private Schools, 2001–17, by Region (original commitment; US$, millions)
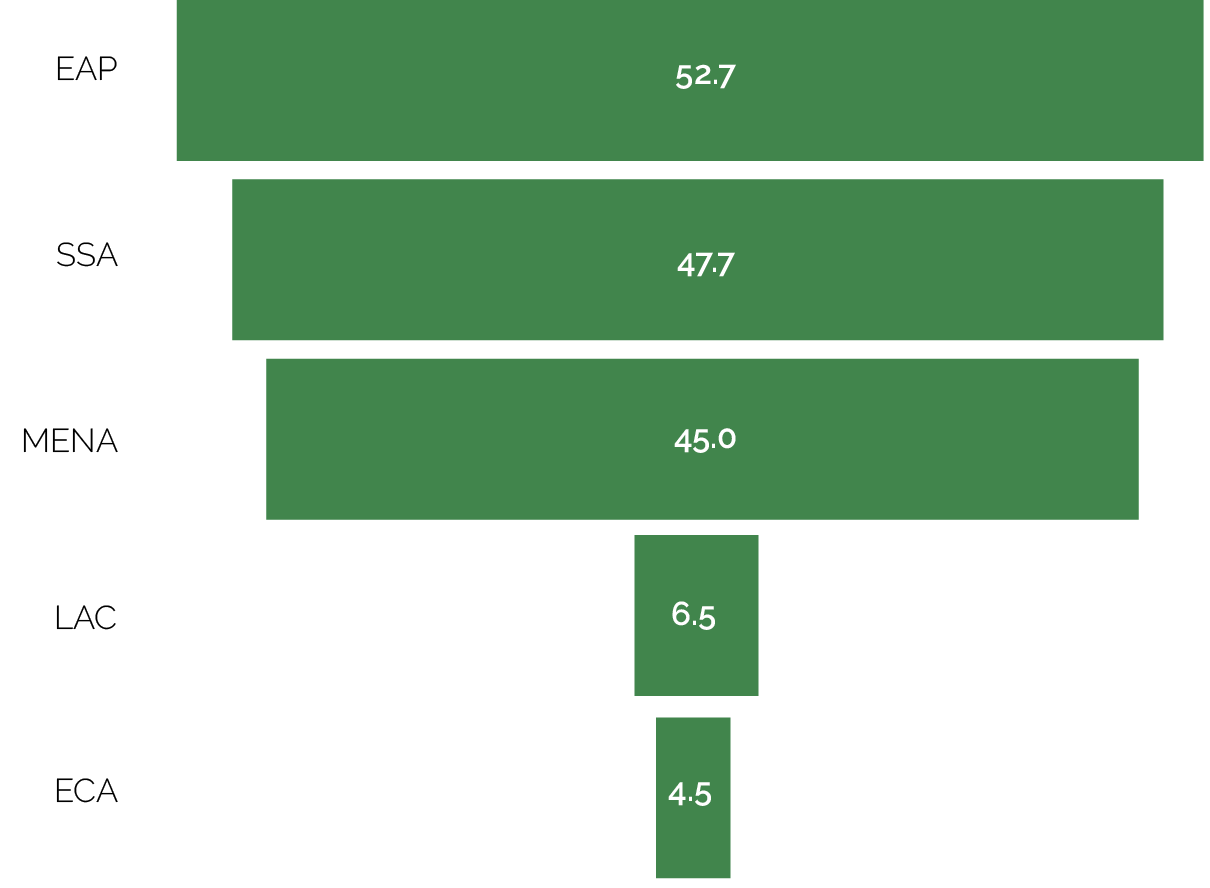
Source: International Finance Corporation management information system reserve database.
Note: EAP = East Asia and Pacific; ECA = Europe and Central Asia; LAC = Latin America and the Caribbean; MENA = Middle East and North Africa; SSA = Sub-Saharan Africa.
Evolution of the Portfolio
IFC’s K–12 private school investments were rooted in its work with SMEs. The earliest projects, between 1995 and 2000, were loan financing using two SME lending facilities, the Africa Enterprise Fund and the Small Enterprise Assistance Funds. These early loans were to small private schools, mostly in IDA countries in Sub-Saharan Africa and often family-owned schools seeking to expand. The projects ranged in size from about $300,000 to $10 million, with IFC loan commitment amounts ranging from about $80,000 to $7 million. Only one investment during this period was financed by a straight loan from IFC to an established network of prekindergarten and K–12 coeducational private schools in South Asia. IFC continued to provide loans to small schools through the SME financing facilities through the first part of the evaluation period. Because of inadequate business performance and high transaction costs—common issues across the entire SME portfolio at the time—the use of SME financing facilities to invest in K–12 schools was discontinued in 2002 (box 2.1).
Box 2.1. IFC Investments in Small and Medium Enterprises
The International Finance Corporation (IFC) last used the Africa Enterprise Fund (AEF) to provide loans to kindergarten through grade 12 (K–12) private schools in fiscal year 2001. The AEF was discontinued in 2007 because of shortcomings in IFC’s ability to undertake, adequately monitor, and supervise retail lending to small enterprises. These projects also had a high incidence of nonaccruals (not disbursed). The Independent Evaluation Group’s 2014 evaluation of IFC support to small and medium enterprises (SMEs) found that “from a financial standpoint, IFC’s experience was disappointing. Although the amounts involved were relatively small, their gross non-accrual rates were much higher than IFC’s portfolio as a whole” (World Bank 2014).
A 2000 evaluation found that the AEF program included viable operations with significant development impacts, and the program might otherwise not have proceeded because of the lack of term financing in Africa and the reluctance of local financial intermediaries to assume the higher credit risk that SME lending involves. However, the failure rate was high—as reflected in the low interest collection rate, negative equity returns to IFC, and high rate of write-offs and reserves—relative to the rest of IFC’s portfolio. The program also was inherently costly and likely to continue requiring cross-subsidy from the rest of IFC’s portfolio to cover its operating expenses. Other limitations of the AEF model limited its efficacy, efficiency, and reach as an instrument of financing support for SME development. These limitations included the following:
- Although IFC provided loans in foreign currency, the most viable SME businesses (those in the services sector) needed local currency.
- IFC’s expertise, structure, and instruments are those of a wholesale international project financier serving large corporate clients, whereas the needs of SME clients are often for working capital, and the business involves “character lending,” often multiple business relationships beyond a single project, and the ability to provide a range of instruments besides term financing.
- IFC’s approach to processing projects under AEF and the resulting unit delivery costs were too high for the volume of its operations.
Sources: IFC 2000; World Bank 2014.
Difficulties with the SME approach to investing in K–12 private schools prompted IFC to change its approach from FY01 to FY08, the first part of the period evaluated. In this period, to encourage domestic banks to provide local currency financing to K–12 private schools in IDA countries and mitigate currency mismatch risks that could affect debt servicing, IFC introduced the RSF, an integrated investment and advisory program. The RSF was intended to help local financial intermediaries develop a new business line by financing small K–12 private schools. The RSF also provided the local partner banks and borrowing schools with advisory support to improve their operations. The RSF was used to support participating local banks in Ghana, Kenya, and Rwanda. The four RSF-supported projects ranged in size from $2.1 million to $12 million, with IFC commitments ranging from $854,000 to $4.8 million. IFC also provided a straight senior loan to finance the expansion into frontier cities of a school operated by a religious order in Latin America and to owners of international schools in middle-income countries (Indonesia and Lebanon) and Kenya, at the time an IDA country, during this period. Compared with the early phase, project size and IFC commitment amounts were larger, especially projects financed by loans.
From FY09 to FY17, IFC shifted focus further, concentrating its support on experienced owners of larger K–12 private schools that were embarking on within-country, cross-border, regional, or even international expansion. By FY09, limitations of the RSF had become evident (box 2.2) and client cancellation of the facility agreement (but not the advisory services component) resulted in IFC’s abandoning the use of this instrument to finance K–12 schools. From FY09 to FY17, IFC financed the national and international expansion plans of nine project sponsors who owned and operated assorted brands of K–12 schools or operated as school chains (multisite schools with brand recognition, often with a predetermined curriculum or teaching methods and practices). During this period, IFC’s investments were primarily straight senior loans. It also offered two loans, convertible to an equity participation in the company at a prescribed date, to a school chain that was expanding in several countries in the Middle East and North Africa Region and a school chain that was expanding to frontier cities in the Arab Republic of Egypt.6 IFC also invested, through an equity participation in, respectively, large school chains in the East Asia and Pacific Region and in Sub-Saharan Africa. The size of the investment projects during this period was much larger than in the past and ranged from $2 million to $50 million, with IFC commitments ranging from $2 million to $22 million.
This investment history indicates an approach that was exploratory overall, with IFC seeking an appropriate investment niche in a risky subsector. Although IFC initially sought to engage small schools in low-income countries, it found that its most viable opportunities lay in larger schools, schools that cater to middle-income and upper-middle-income students, clients that have diversified sources of revenues other than tuition fees, and whole networks of schools in middle-income countries. It was, therefore, practical in its search for an entry point in the subsector even as it was exploring its options transaction by transaction, without internalizing lessons learned from its projects and without assessing the impact of its K–12 private school investments on the overall education system, including potential positive or negative spillover effects.
Box 2.2. Operational Challenges in the Use of IFC’s Risk-Sharing Facility
The Risk-Sharing Facility (RSF) had several flaws that made it a less attractive financing instrument for the partner banks and the International Finance Corporation (IFC). First, the design and structure of the instrument were disincentives and operationally cumbersome to implement. Here are three examples:
- The RSF required partner banks to have a sophisticated management information system to identify in advance the pool of eligible borrowers to be covered before the signing of the RSF agreement. It also required partner banks to closely monitor the financial and operational performance of each borrower and ensure that they complied with other IFC requirements, all of which is data intensive and requires up-to-date data collection to file claims with IFC for the first-loss component. In several instances, the partner banks did not have the capacity to meet these requirements.
- The RSF required intensive IFC involvement in the vetting process, assisting in pre-identifying the eligible borrowers and verifying the borrowers’ financial and operational performance.
- To file a claim under the RSF, the partner bank had to identify—from among the agreed-on pool of loans—the individual kindergarten through grade 12 (K–12) school borrower accounts to be included or excluded from the claim. The partner bank then had to submit to IFC the repayment history of each of the borrowers in default, along with proof that the bank tried and had recovered part of the nonperforming loan against the collateral provided. IFC, for its part, had to verify each borrower account submitted by the bank and determine which accounts were eligible to be paid before compensating the bank under the RSF. The local partner banks and IFC did not have the capacity to monitor every borrower, and IFC was not effective in monitoring the results and performance at the sub-borrower level, even in its regular investments in financial intermediaries.
Second, although the RSF is a loss-sharing facility, IFC’s appraisal process and treatment of the project were similar to that of a loan. Each project underwent the same appraisal, financial assessment, and review process (such as meetings and endorsement by the Credit Review and Investment Review Committees) and required approval by the IFC Board of Executive Directors regardless of the size of IFC’s commitment.
As with its other investments in financial institutions, IFC requires the partner bank’s compliance with IFC’s environmental, health, safety, and social standards and governance requirements, and adherence to certain financial covenants and tracking of development indicators at the borrower level that relies on the partner banks to provide the required information. These requirements have added to the transaction cost of the RSF for both the partner banks and IFC.
Finally, the pricing advantage that the RSF as an investment tool provides to the partner bank may be minimal. Since IFC compensates the partner bank for losses only after the bank fully absorbs the first-loss tranche, the partner bank may only get a small basis point benefit from the RSF after all IFC fees are considered. That advantage may not be enough to compensate the partners, who use their own funds and capital to lend and conduct the intensive preparation and monitoring required.
Sources: Independent Evaluation Group portfolio review analysis and case studies.
- For more information about Sustainable Development Goal (SDG) 4 and specifically SDG 4.1, see https://en.unesco.org/education2030-sdg4/targets.
- From its 2001 education strategy onward, the International Finance Corporation (IFC) anticipated that its support to primary and secondary education would be in the “low probability” category compared with the other education subsectors.
- Two investee companies received investments from IFC Funds’ clients for their global operations.
- IFC tracks development outcomes of the funds’ investments, including for the kindergarten through grade 12 (K–12) portfolio of funds; however, the outcomes tracked are sector-agnostic (for example, number of jobs) and not specific to the sector of operation (for example, number of students). This is because of the uncertainty about the specific portfolio companies at the time of investment because IFC invests and sets targets based on Fund strategy before the fund investing in portfolio companies, rather than on an established portfolio.
- The indirect Fund investments were more evenly distributed but still strongly focused on Sub-Saharan Africa. Fifteen of 26 investee companies in the Funds are in International Development Association countries, and 5 are in fragile and conflict-affected situations.
- IFC also financed two K–12 school projects sponsored by two subnationals (municipalities) during this period. These were the only public-private partnership K–12 schools it financed.