
Using Qualitative Comparative Analysis to Explore Causal Links for Scaling Up Investments in Renewable Energy
4 | Application of Qualitative Comparative Analysis: Strategic Decisions and Case Study Analysis
This chapter details the steps the Bank Group’s IEG took to carry out the QCA for the RE evaluation, in line with figure 3.1 in chapter 3.
Developing a Theory of Change
The first step in carrying out a QCA requires the development of a ToC or the adoption of an existing one. The ToC should clearly define the potential causal links that will be tested and refined through the QCA process. The development of the initial ToC itself may need to be an iterative process to ensure that the theoretical concept is robust and based on sound experience. It is vital to include subject matter specialists who have the necessary expertise to contribute to the development of the ToC. This may also be augmented with desk research (literature review). If an existing ToC is used, it may also require adjustments depending on the specific subject matter being tested through QCA. This will also require inputs from subject matter specialists and possibly coordination with the original preparer of the ToC.
The ToC for the RE evaluation was developed with a team of energy sector specialists with experience developing RE, those with expertise in investment projects supported by the Bank Group, and evaluators who specialize in multimethod evaluations.
The concept was also developed with input from a sector literature review. The resulting ToC is illustrated in figure 4.1.
Figure 4.1. Theory of Change for Renewable Energy Development

Figure 4.1. Theory of Change for Renewable Energy Development

Source: Independent Evaluation Group.
Note: RE = renewable energy.
The ToC is most easily understood beginning in column C in figure 4.1, which depicts the output as increasing investments in RE technologies. This essentially means the construction and operation of RE power plants and associated infrastructure such as transmission lines to transport electricity to consumers (that is, to load centers). The production of RE-based electricity is also theorized to displace an equivalent amount of alternative generation from fossil fuels, also depicted under column C.
Column D identifies the outcomes that result from the increased investments in RE and the displacement of fossil-based power generation illustrated in column C. The increase in investments in and production of RE-based electricity to the power grid supplies consumers who benefit from the use of this electricity. The production of RE-based electricity can also help increase access to those who are currently not connected; and, as indigenous resources, RE-based electricity can reduce energy insecurity that arises from reliance on fossil fuel imports. As RE-based power generation expands, the resulting displacement of fossil fuel–based electricity will help curtail the emission of carbon dioxide (CO2)—a greenhouse gas that contributes to global climate change. As a result, a key outcome of developing RE is the anticipated avoidance of global pollution. Additionally, the replacement of fossil fuels also helps avoid local pollution that can lead to respiratory illnesses and other health impacts. The emission of sulfur oxide, nitrogen oxide, and particulate matter from fossil fuel combustion is also avoided when electricity is produced from RE.
Although columns C and D identify a causal relationship between outputs and outcomes, the mobilization of investments to develop RE resources faces major barriers in most countries, which are the preconditions or factors that will be tested through QCA. These precondition barriers, separated into six major categories based on input from subject matter specialists and from review of literature, are illustrated in column B. Theory and experience suggest that these barriers constrict the investment climate for RE and need to be addressed to scale up electricity produced from RE, which in turn, will offset equivalent production from fossil-based technologies. Sufficiently overcoming barriers should mobilize investments in RE-based power generation facilities and associated infrastructure, leading to the energy and environment outcomes defined in the ToC.
The QCA will assess the causal model proposed by the ToC (the three shaded columns in figure 4.1), testing the relationships between addressing precondition barriers (column B) and mobilizing investments in RE and displacing fossil-based generation (column C) and whether the results are electricity supply and global environmental outcomes being realized (column D). However, the overall ToC extends beyond the application of the QCA and conceptualizes two additional aspects. First, it notes that energy and environmental outcomes and outcomes from other development efforts are interdependent, contributing together toward an overall set of development impacts, depicted in column E. They include the contribution to economic growth, improvements in the lives of people living in poverty, and the protection of the local and global environments. Second, because the overall RE evaluation is designed to assess the Bank Group’s performance in supporting RE, column A represents the support provided by the institution to client countries to address various barriers to RE (column B). This support includes providing funding support (loans, grants, and guarantees), sharing global knowledge and experiences, and convening partners to also mobilize the same. It should be stressed that the QCA is applied to information related to columns B, C, and D, and not to columns A and E, which are evaluated through other methodological means in the overall RE evaluation (see box 2.1).
Identifying Country Case Studies
The next step in the QCA process was to identify case studies that would provide the data required for the analysis. For the RE evaluation, the case studies were prepared at the country level to determine the extent to which different countries addressed key precondition barriers to RE development and mobilized investments that would lead to scaling up and securing energy and environmental benefits.
The case studies were prepared by sector specialists with extensive experience in RE in developing countries, although not necessarily in the specific countries that they were assigned to evaluate. The country case studies were prepared not solely for the QCA but also to serve multiple purposes in the complex RE evaluation. In fact, the case studies were conceptualized before the QCA, although its structure was based on the overall ToC developed for the RE evaluation. However, the QCA approach was formulated and fully embedded into the case study design before the country-specific work was carried out. Moreover, each case study preparer became familiar with the QCA, was instructed how to tabulate the data and score against the established criteria to adhere to a QCA format, and was informed how these efforts would contribute to the QCA.
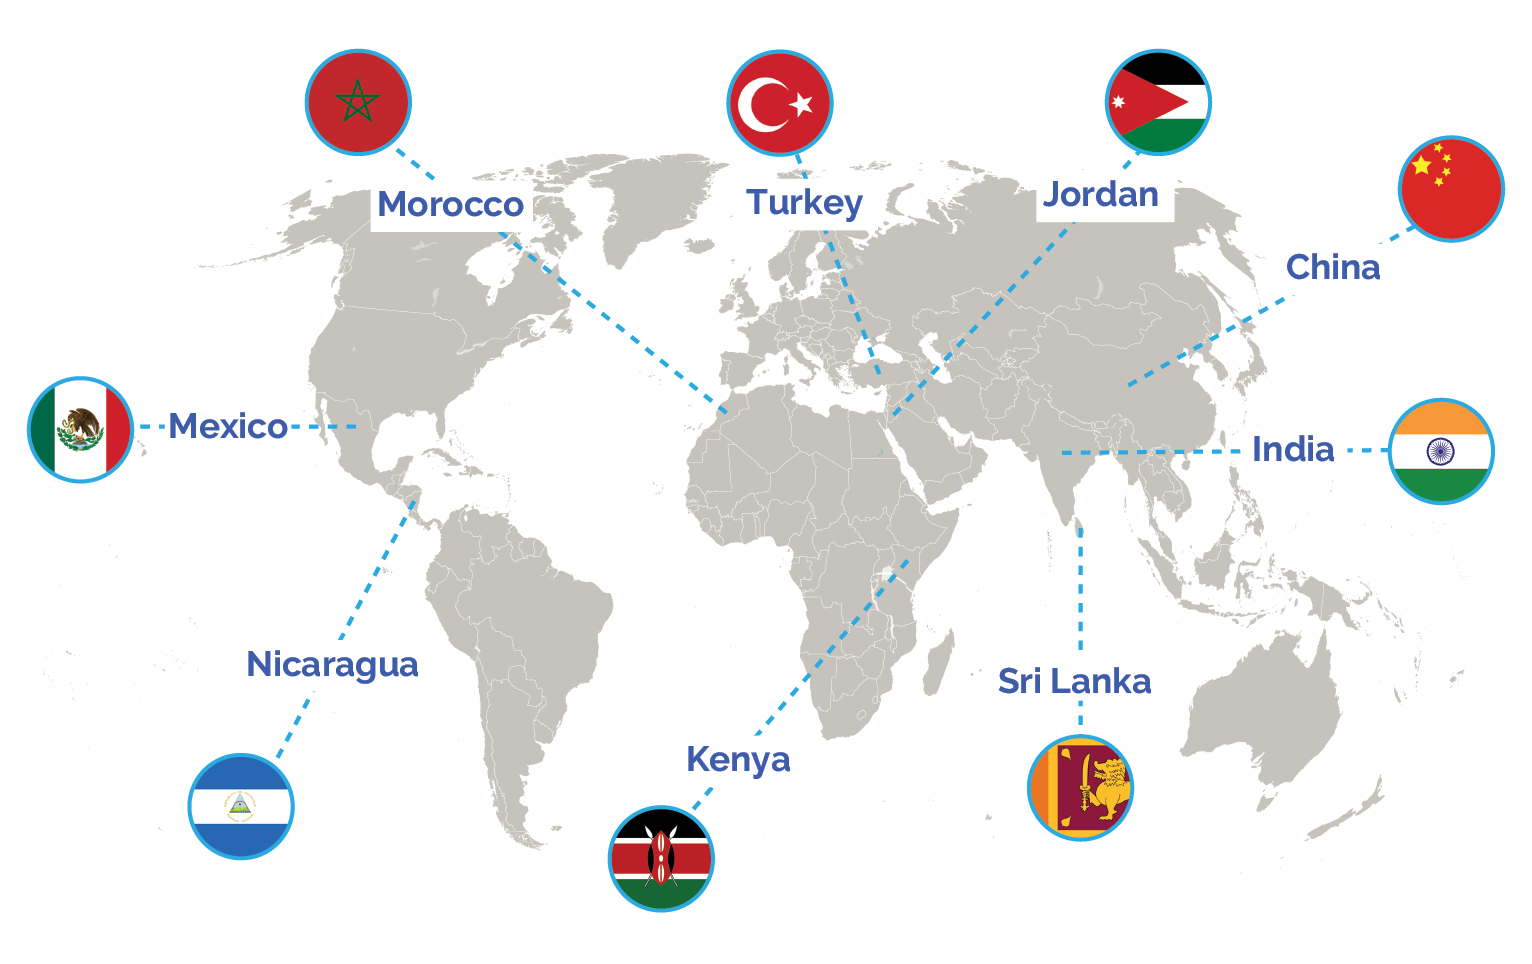
Nine countries were purposefully selected for in-depth case work, as illustrated in map 4.1. The initial aim was to carry out up to 15 country case studies, but the evaluation faced budget constraints because preparing original case studies can be costly. However, undertaking original case work has the benefit of customizing the inquiry to meet the specific needs of the evaluation. Thus, it was decided that the nine selected countries would suffice if they were sufficiently representative and adequately in-depth, since one advantage of QCA is its ability to identify potentially generalizable inferences from a small number of cases. The selected number of cases surpassed five, which is typically considered a minimum for QCA, and with nine cases the evaluation applied in-depth case knowledge, particularly for understanding outlier cases, to a greater extent than cross-case analysis.1
Countries were selected for the case studies based on balancing several criteria to have an adequate representation of significant sources of variation that would influence expansion of RE. The key criteria applied in country selection included the following:
- Global geographical variation among emerging markets, especially since the Bank Group has client countries across developing regions,
- Availability of a diverse array of renewable natural resources across the selected countries,
- A mix of public and private markets for RE investments that signify the nature of various barriers facing investment mobilization,
- A blend of larger and smaller markets where the nature and magnitude of scaling up RE would vary, and
- Bank Group support for RE activities in the country, since the overall multimethod RE evaluation was designed to evaluate the institution’s performance.
The Energy Evaluation
Map 4.1 shows the nine countries selected for the in-depth case studies in the RE evaluation. Although budget constraints prevented comparative case studies in countries without a Bank Group program, the institution is supporting RE in an expansive 98 developing countries worldwide. Therefore, the selected countries provided the needed diversity of key characteristics noted in the selection criteria. For example, China, India, and Mexico represented larger markets with substantial populations. They are expected to play prominent roles in the clean energy transition. Nicaragua and Sri Lanka represented medium-scale countries, and Jordan and Morocco represented smaller markets. Similarly, the proportion of public and private participation in the energy sector in general and RE in particular also ranged across the selected countries. This included countries such as Jordan and Turkey and that have transitioned from greater public control to more private participation in RE over the evaluated period. The collective nine countries were also endowed with renewable resources that covered all major technologies. Country case studies for China, India, Kenya, Nicaragua, and Sri Lanka were prepared with in-country visits, and desk research was the primary source of information for the remaining four countries. All case studies included interviews with Bank Group and external stakeholders to ensure the accuracy of the findings and to incorporate the views of different stakeholders. The selected case studies were adequately representative of important distinguishing characteristics of the RE sector.
Map 4.1. Country Case Studies Selected for Qualitative Comparative Analysis in RenewableSource: Independent Evaluation Group.

Map 4.1. Country Case Studies Selected for Qualitative Comparative Analysis in RenewableSource: Independent Evaluation Group.
Source: Independent Evaluation Group.
Developing a Set of Factors or Preconditions
To adequately prepare case studies and carry out QCA, it is essential to clearly define the preconditions, and establish criteria for rating them within each country example.
The six preconditions or factors applied in the evaluation are barriers to RE development, as shown in the figure 4.1, which illustrates the ToC. They include the following barriers that affect the investment climate for RE: (i) inadequate policies and regulations, (ii) inability to integrate RE into power systems, (iii) insufficient design and technical standards, (iv) weak institutional and human capacity, (v) existence of significant investment risks, and (vi) constraints to mobilizing financing. More detailed definitions of the precondition barriers are presented in table 4.1. The case study specialists were tasked with determining the extent to which the country had addressed these precondition barriers to facilitate RE investments. To make this determination consistently across all case studies, a clear set of criteria was established.
Table 4.1. Major Barriers to Renewable Energy Development
|
Barrier |
Description |
|
Inadequate policies and regulations |
Shortcomings in the policy and regulatory environment established by governments can hinder public and private investments in RE, especially when they do not provide adequate opportunities or incentives for investors |
|
Inability to integrate RE into power systems |
Inadequate planning, transmission bottlenecks and insufficient capacity, limited scope for power trading and pooling, and inability to store electricity can all result in inflexibility of power systems to smoothly and efficiently integrate RE, especially as the share of variable RE such as wind power and solar photovoltaic increases. |
|
Insufficient design and technical standards |
Insufficient design and technical standards can make it difficult to consistently develop high-quality RE infrastructure in line with industry practices and international standards. |
|
Weak institutional and human capacity |
In many developing countries, various institutions involved in the development of RE do not have sufficient capabilities to undertake new investments or operate ongoing projects. |
|
Existence of significant investment risks |
Even with improved policies and enhanced institutional capabilities, projects may face residual risks: either transitional risks, while reforms are being implemented, or permanent risks that are outside the control of developers and which may discourage investments (these include commercial or offtaker risks, political risks, and RE resource risks). |
|
Constraints to mobilizing financing |
In addition to already identified barriers, the typically high up-front investments make it more challenging to mobilize financing for RE. This can occur when RE technologies are new to certain markets, at a scale that exceeds the capacity of domestic capital markets, or in small markets where financial institutions are not well developed. |
Source: Independent Evaluation Group.
Note: RE = renewable energy.
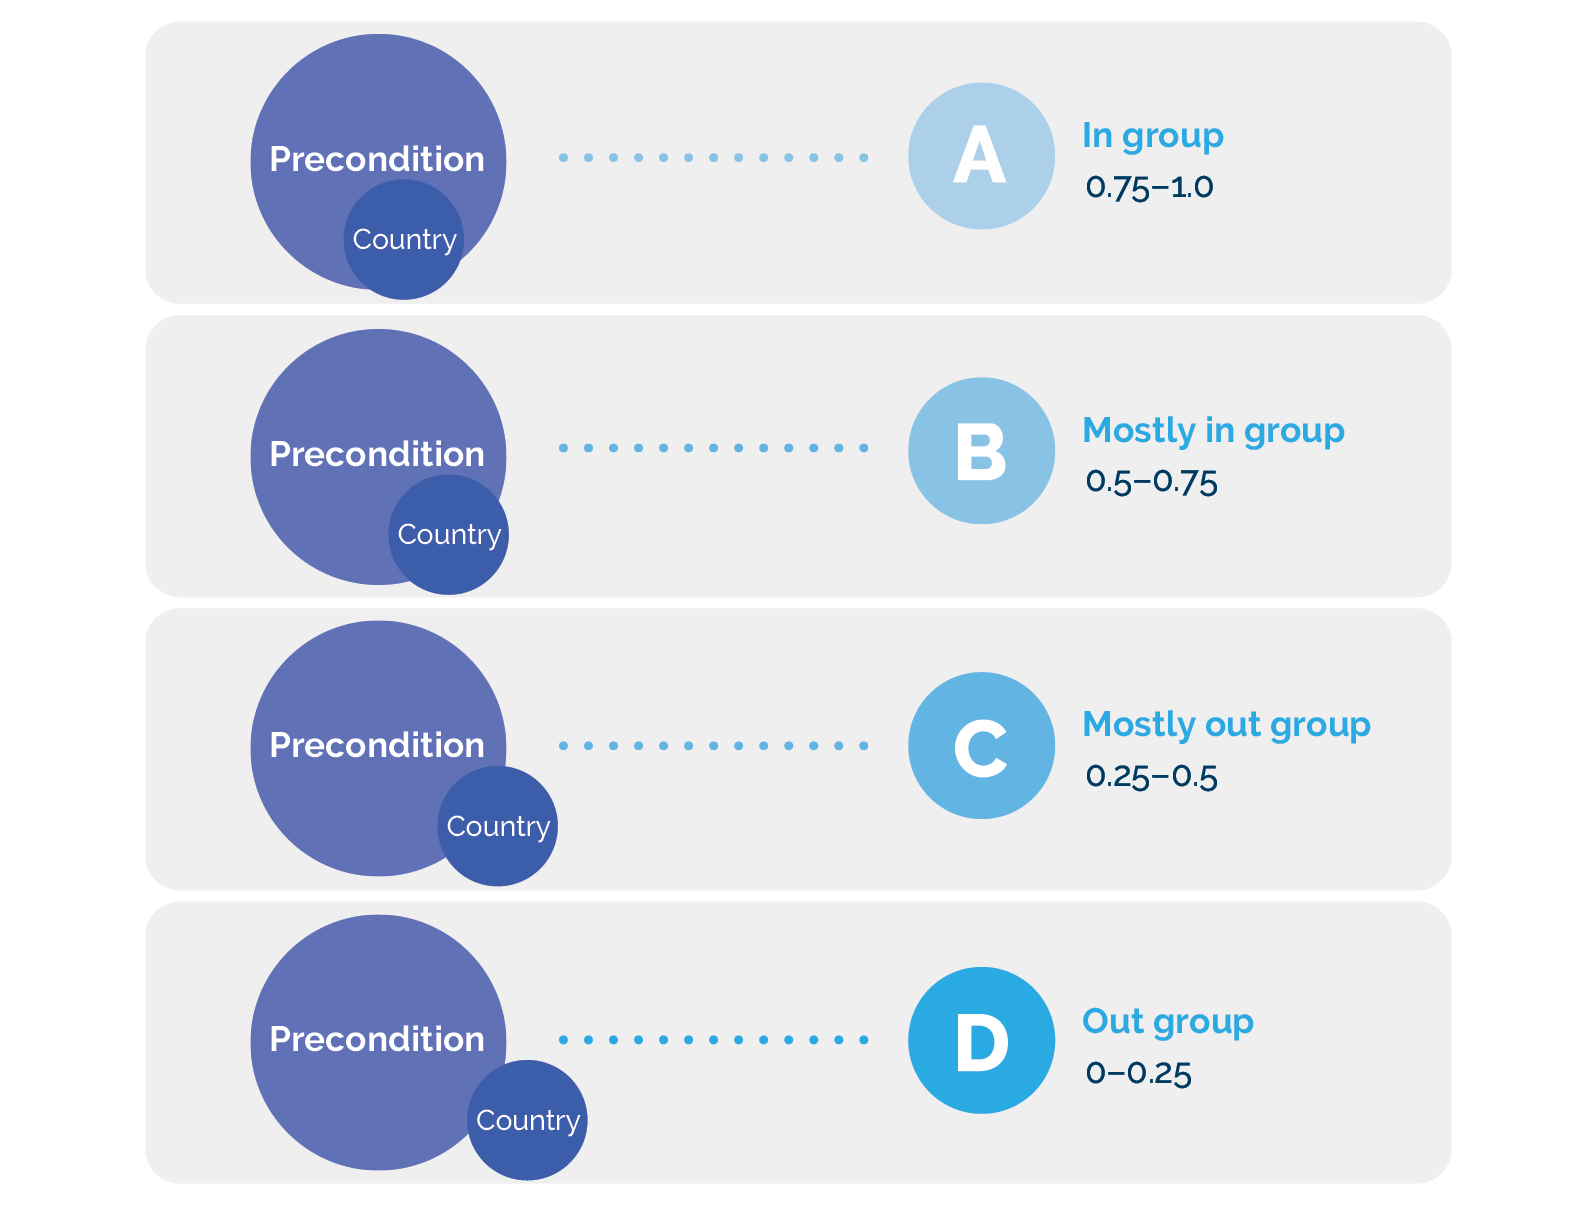
QCA requires the relationship between a specific case and each precondition to be established based on the extent to which the barrier was addressed. The case study specialists were tasked with determining whether the country they were assessing for a given RE barrier falls “within group” or “outside group.” For the RE evaluation, the extent to which a precondition barrier was addressed was classified into a fuzzy set of four progressively different relationships to a group. Figure 4.2 illustrates these different relationships to the group, which reflected the different degrees to which a country overcame specific barriers to RE development. This required clear definitions for criteria that case study specialists could apply to screen and score the relationship between the circumstances in each assessed country to the respective precondition barrier group. If the precondition met the criteria for fully addressing a specific precondition barrier, then it would be considered fully within the group (in group) and would be given a score between 0.75 and 1.0 (the score within the range also indicated the extent to which it successfully addressed the precondition). Similarly, a country that did not adequately address a specific precondition barrier as per the defined criteria would be considered as falling outside the group (out group) and assigned a score between 0 and 0.25. Countries that fell mostly within group or mostly outside the group based on the defined criteria were scored within the ranges of 0.5 to 0.75 and 0.25 to 0.50, respectively. An example is illustrated in box 4.1, and detailed criteria for classifying and scoring each barrier precondition is provided in appendix A. The example in box 4.1 highlights the significant levels of sectoral nuance that are required to create criteria for a fuzzy set, which also requires considerable subject matter expertise to apply and evaluate. Despite the complexity, a fuzzy set of criteria will lead to results and insights from the analysis that are likely to be richer and more robust with greater differentiation of group relationships than the simpler binary option in a crisp set criteria (that is, in or out of group).
Figure 4.2. The Relationship between Country Cases with Preconditioned Barrier Groups

Figure 4.2. The Relationship between Country Cases with Preconditioned Barrier Groups
Source: Independent Evaluation Group.
Box 4.1. Example of Setting Criteria for Scoring Precondition Barriers to RE Development
To ensure consistent coding across the nine countries included in the analysis, the specialists carrying out the in-depth case studies were provided specific scoring criteria for measuring the degree to which a given precondition barrier has been overcome in the country. Below is an example describing the criteria for scoring the degree to which a country has improved design and technical standards. Similar criteria were defined for each of the six precondition barriers, which are detailed in appendix A.
Table B4.1.1. Example Criteria for Scoring Precondition Barriers
|
A In group 0.75–1.0 |
Industry and international standards for project design, development, and operation for renewable energy (RE) are established at the country level covering most of the significantly available RE technologies. Similar international and industry standards are adapted for the country context and adopted for major RE equipment. All of these standards related to RE are vigorously enforced during implementation. |
|
B Mostly in group 0.51–0.74 |
Industry and international standards for project design, development, and operation for RE are established at the country level, covering some specific available RE technologies. Similar international and industry standards are adopted for RE equipment but at times are not fully adapted for the country context. All of these standards related to RE are mostly enforced during implementation. |
|
C Mostly out group 0.25–0.49 |
There are few standards affecting RE development that are consistent with industry and international standards; ones that are established are typically loosely enforced; often higher standards and good practices are applied only when required by development partners or project financiers. |
|
D Out group 0–0.24 |
There are no established standards in the country for RE that are consistent with industry practices and international standards for design and implementation of RE or RE equipment; application is inconsistent and ad hoc. |
Source: Independent Evaluation Group.
Scoring the Factors or Preconditions
Equipped with the ToC, the barriers that should be explored, and the scoring criteria, the specialists prepared the case studies for the nine countries. The case studies included a variety of information exploring electricity supply and demand in the country; the power sector structure; the institutional setup, including the roles of the public and private sectors; policies and regulations in place; electricity costs and pricing; RE resources availability; the status of RE development; and plans for scaling up in the future, among other aspects. The case studies also included the performance of the Bank Group’s RE portfolio during the evaluation period for the purposes of the broader RE evaluation, although this information was not directly used in the QCA. The case study specialists used the in-depth understanding obtained about the country and sector to translate the qualitative assessment of addressing barriers into quantitative scores based on the established common criteria.
To ensure that the scoring was correct and consistently applied across countries, the team overseeing the overall evaluation, including a QCA methodology specialist, met with each case study specialist. It was an opportunity to discuss their findings and ensure that their assessments were calibrated to the established standards and scored appropriately. This effort was the first of two important initiatives to calibrate the assessment across countries for greater consistency. After the individual discussions, the scores for each country were transferred to an overall matrix representing all nine cases, in preparation for a subsequent group discussion with all country case study specialists, the team overseeing the RE evaluation, and two QCA methodology specialists (who carried out the analytical work during the next stage). Convening this broader evaluation team led to clarifying edits in the qualitative membership statements and revisions to measures of outcome variables related to energy and environmental benefits. It was a crucial step, since a group discussion enabled the sharing of information among the case study specialists, further clarification of scoring criteria, and better calibration of scores across countries for improved consistency.2 The final consensus-based recalibrated scores are shown in table 4.2 (and a more detailed data-collection matrix is presented in appendix B).
Table 4.2. Scores from Country Case Studies
|
B Barriers |
C Outputs |
D Outcomes |
|||||||
|
Country |
Policies and Regulations |
Integration into Power Systems |
Design and Technical Standards |
Institutional and Human Capacity |
Investment Risks |
Mobilizing Financing |
Develop Renewable Energy |
Energy Benefits |
Environment Benefits |
|
China |
A (0.80) |
B (0.70) |
A (0.90) |
A (0.90) |
B (0.70) |
A (0.90) |
A (0.84) |
A (0.79) |
A (0.94) |
|
India |
A (0.85) |
A (0.80) |
B (0.55) |
A (0.90) |
B (0.60) |
B (0.70) |
B (0.56) |
C (0.36) |
B (0.61) |
|
Jordan |
A (0.80) |
B (0.70) |
B (0.70) |
C (0.40) |
B (0.60) |
C (0.40) |
C (0.48) |
C (0.27) |
C (0.41) |
|
Kenya |
B (0.70) |
D (0.20) |
A (0.80) |
C (0.40) |
B (0.60) |
A (0.80) |
C (0.40) |
C (0.38) |
C (0.30) |
|
Mexico |
B (0.70) |
A (0.90) |
B (0.70) |
B (0.70) |
B (0.60) |
B (0.60) |
B (0.69) |
B (0.60) |
B (0.69) |
|
Morocco |
B (0.55) |
B (0.60) |
C (0.40) |
C (0.40) |
B (0.60) |
C (0.40) |
B (0.54) |
C (0.37) |
B (0.58) |
|
Nicaragua |
B (0.70) |
B (0.60) |
C (0.40) |
C (0.40) |
C (0.40) |
C (0.40) |
B (0.64) |
B (0.57) |
B (0.60) |
|
Sri Lanka |
B (0.70) |
B (0.60) |
B (0.60) |
B (0.60) |
B (0.70) |
B (0.60) |
B (0.64) |
B (0.55) |
B (0.68) |
|
Turkey |
A (0.80) |
A (0.90) |
A (0.90) |
A (0.80) |
B (0.70) |
A (0.80) |
A (0.86) |
A (0.80) |
A (0.90) |
Source: Independent Evaluation Group.
Note: The letters in the first row of headings correspond to the columns in the theory of change in figure 4.1. Output reflects the rounding conventions used by the software.
The matrix also included scores reflecting country relationships to groups for the outputs and outcomes in the ToC (columns C and D in figure 4.1). These were based on industry-recognized global data sets that include information for each of the case study countries. The installed capacity of RE (column C, “Output,” in figure 4.1) for each country was based on data from the United States Energy Information Agency. The respective scores were determined by comparing the relationship of each case study country situation with that of the global average for developing countries (reflecting Part II developing countries that borrow from the Bank Group). If the total installed capacity of RE (in megawatts) in a given case study was above 75 percent of the global average for developing countries, then the country was categorized as A (fully in group). If the RE capacity in a case study was in the second quartile, more than at least 50 percent of countries but less than the top 25 percent, it was classified as B. In countries classified as C in the third quartile, the installed capacity of RE was less than at least 50 percent of developing countries globally but higher than the bottom 25 percent. Those countries where the RE installed capacity was less than 25 percent of the global developing country average were in the bottom quartile, classified as D. The installed capacities of RE were adjusted for country populations so that the results would not skew toward the larger-scale countries. More detailed information on the classification criteria for the installed capacity of RE is presented in appendix A.
The matrix also included information reflecting the final causal link in the ToC used for the QCA, reflecting the relationship between installed capacity of RE (column C, figure 4.1) and global energy and environmental benefits (column D, figure 4.1). The information for energy and environmental outcomes was sourced from the International Energy Agency. The electricity supplied to the power grid from RE resources (kilowatt hours) were adjusted for their populations, and the results classified into percentile groups between 0.0 and 1.0. A higher percentile score reflected a higher level of electricity produced from RE resources. The global environmental benefits were measured as follows: CO2 emissions specifically from electricity generated (grams of CO2 per kilowatt hour) were multiplied by the RE share in total electricity production to calculate the counterfactual avoided emissions, which were then adjusted for the countries’ populations. The avoided emissions figures were also classified into percentile groups between 0.0 and 1.0 based on their ranking across developing countries. A higher percentile score reflected a higher value of avoided emissions.
The final matrix included scores reflecting the status for each country at the end of the evaluation period across the key causal links defined in the ToC as follows: (i) the extent to which barriers to RE development were addressed, (ii) the installed capacity of RE based on the investments that were mobilized, and (iii) the resulting electricity supply and global environmental benefits.3
- Most qualitative comparative analysis projects examine between 15 and 50 cases, relying upon both cross-case and within-case analysis to draw their conclusions. Studies with fewer cases, such as this one, typically lean more heavily on in-depth case knowledge, particularly for understanding anomalous or aberrant cases, but studies with more cases place greater emphasis on the cross-case regularities. That is because a greater number of cases naturally limits the degree to which a research team may conduct in-depth case studies. Therefore, those qualitative comparative analysis projects with fewer cases tend to be more qualitative and case oriented, and those with more cases tend to be more quantitative and variable oriented.
- Further intercoder reliability was not tested, as theory may suggest, because it was not deemed to be necessary nor practical in application to have multiple case study specialists review each country case study for consistency.
- Based on data availability, the installed capacity of renewable energy was from United States Energy Information Agency data in 2015, and the International Energy Agency was the source for the electricity supply data from renewable energy in 2015 and the carbon dioxide emissions from 2014.