
Advanced Content Analysis: Can Artificial Intelligence Accelerate Theory-Driven Complex Program Evaluation?
3 | Results
Can Supervised Machine Learning Automate Theory-Driven Content Analysis?
The first learning goal was to assess whether SML can use text classification models to accurately replicate manual content analysis and to consider whether these models can perform analyses quickly and efficiently. Project reports from a set of interventions within the World Bank’s stunted growth and chronic malnutrition portfolio were selected as the body of evidence to pilot this approach. This included 392 unique project reports from 64 countries, with a total commitment of $28.8 billion.
The first step involved the production of training material in the form of correspondence tables. World Bank IEG experts reviewed the content from the various types of project reports and their relevant sections to select text of interest. This text was then pasted into the correspondence table using a simple data extraction template and labeled with hierarchical classification codes (levels 1 through 4) that fell under five label categories. To make the labeling process theory driven, the classification categories and codes related to the various components of the portfolio ToC. There were 74 labels under the three main label categories: “nutrition challenges addressed,” “interventions,” and “outcome indicator achievement.” Text placed under the “factors affecting success or failure” label category was left unclassified except for labeling the content as either a ”success factor” or ”failure factor.” Examples of the categories and labels used are presented in table 3.1.
The content from the correspondence table guidance material was then used to train the (multiclass) text classification model. Data from all countries and label types were used to train the model. The exceptions were data from the pilot country, which was retained for use as an unseen test case to assess the performance of the model, and data under the “factors affecting success or failure” label, which was left uncoded for use in the UML model.
Initial exploratory analysis suggested that training the text classifier model using these data would be challenging. This was because the data were highly imbalanced by class. This occurs when some labels are used frequently (more than 200 inputs per label) and others are rarely used (fewer than 10 inputs per label). As a result, there are many types of labels to predict but few examples of less frequent labels to learn from.
Table 3.1. Example of Correspondence Table Guidance Material Categories and Labels
|
Example |
Project Identifier Information |
Nutrition Challenges Addressed |
Interventions |
Outcome Indicator Achievement |
Factors Affecting Success or Failure |
|
1 |
Project ID |
Underlying determinants of undernutrition |
Institutional strengthening |
Underlying determinants of undernutrition |
Factors affecting success or failure |
|
2 |
Country |
Access to health services |
Support to improve nutrition service delivery |
Access to health services |
Failure factor |
|
3 |
Document type |
Utilization of child health care |
Utilization of child health care |
||
|
4 |
Section of document |
Outcome achieved |
Source: Independent Evaluation Group.
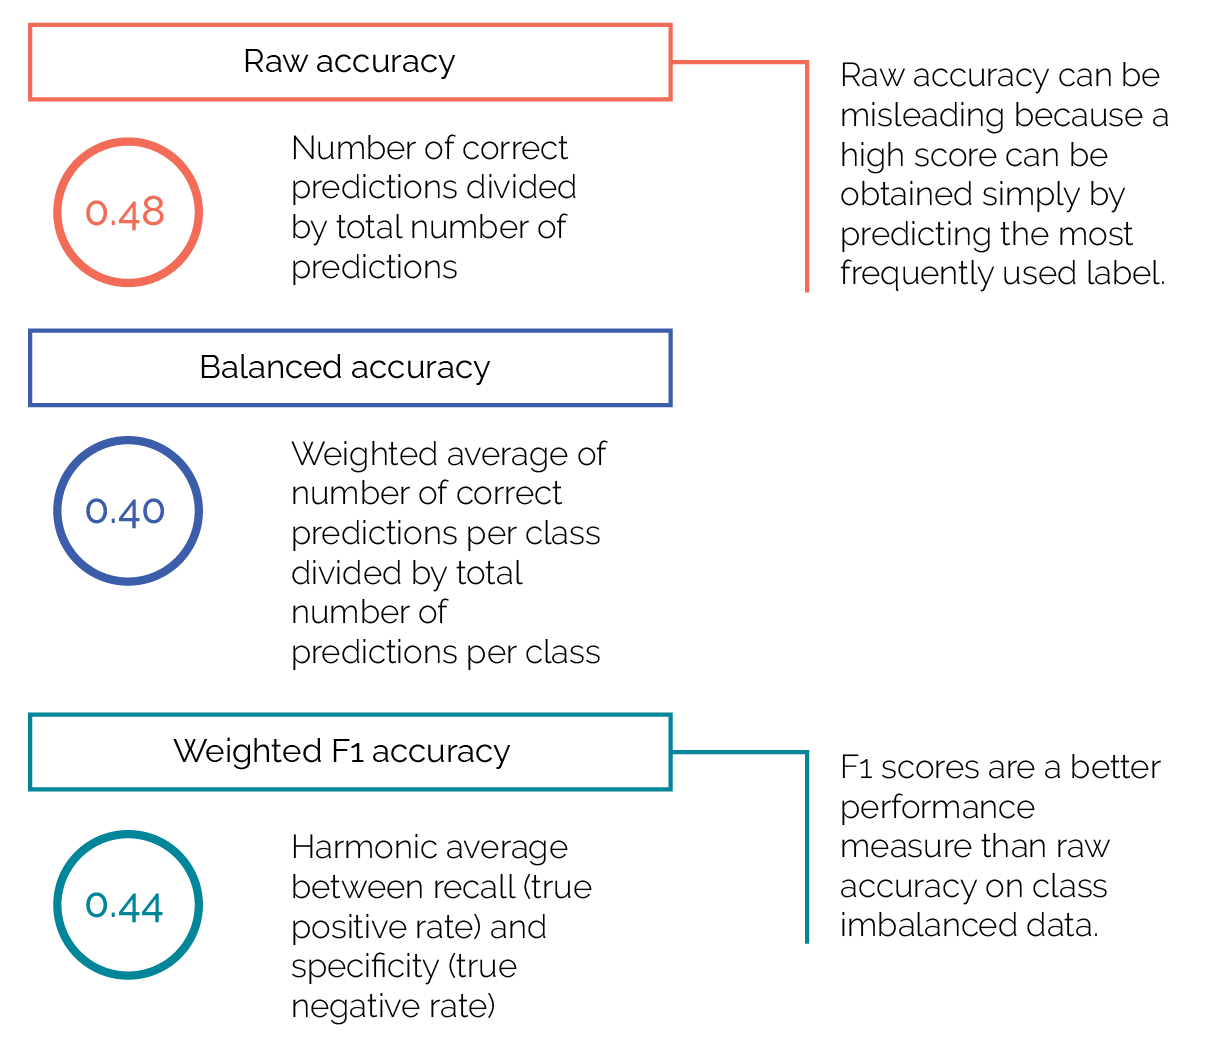
Despite the challenges inherent in highly class-imbalanced data, the model showed promising results in its ability to predict expert labels from training data. This was achieved by using multiple classification algorithms and different preprocessing and feature engineering methods to optimize the AI model. Once the model was optimized, it was tested on the unseen project data from the pilot country. Performance was modest in terms of the model’s ability to predict the exact classification label, with a weighted F1 accuracy score of 0.44 (figure 3.1).
Figure 3.1. Supervised Machine Learning Accuracy Scores for Predicting Exact Labels in the Pilot Country Test Case

Figure 3.1. Supervised Machine Learning Accuracy Scores for Predicting Exact Labels in the Pilot Country Test Case
Source: Independent Evaluation Group.
However, this performance must be understood within the context of selecting from 74 different class-imbalanced and hierarchical sublabels at the lowest classification level, among three label categories at the top level (nutrition challenges addressed, interventions, and outcome indicator achievement). This is a particularly challenging task.
When assessed by whether the model predicted the correct top-level category (even if it got the sublabel wrong) the algorithm performed much better, with an average accuracy of 192 out of 202 predictions. The model was able to predict the correct top-level category with an average accuracy of 90–95 percent (F1 and raw or balanced accuracy score). The average size of the training set was 274 projects, and the average size of the held-out test set was 118 projects.
The high accuracy in predicting top-level categories suggests that the results achieved in this preliminary work could be improved. This would enable the text classifier model to provide direct statistical evidence to test the ToC by tallying results for labels that correspond to different components of the ToC.
However, even at this early stage of development, the SML offers important insights that cannot be obtained through traditional methods. For example, to determine whether the pilot country would be an appropriate test case for the text classifier model, we converted the text data into numerical form and then used t-distributed stochastic neighbor embedding (t-SNE) visualization to determine if the pilot country and 11 other countries were statistically distinct from all other countries in terms of their nutrition challenges addressed, interventions, and outcome indicators achieved.
We used NLP and vectorization methods to translate each high-dimensional data point into a simple two-dimensional representation that preserves valuable information about the original meaning of the text; data points that are similar to each other in original meaning are closer together than data points that have different meanings. We represent these two-dimensional data points in a t-SNE visualization where the data points that are close to each other refer to similar issues or topics.
Using this t-SNE visualization, we were quickly able to provide a powerful visual assessment that showed only 17 data points from five countries were distinct, out of a data set of 5,468 data points. The t-SNE visualizations from these five countries are shown in figure 3.2. The diagrams show how we can project high-dimensional text data onto a two-dimensional plane where points with similar meanings are close to each other.
The results suggest relatively little variability among World Bank country programs except in specific areas. For example, the pilot country showed a statistically distinct focus on water sanitation and hygiene. The pilot country’s water, sanitation, and hygiene cluster is distinct because it is the most geometrically distant of all clusters and only contains pilot country data, unlike other (less separated) clusters, which contain data from multiple countries.
Figure 3.2. t-SNE Visualization of Statistically Distinct Challenges, Interventions, and Outcome Indicator Achievement for the Five Selected Country Programs

Figure 3.2. t-SNE Visualization of Statistically Distinct Challenges, Interventions, and Outcome Indicator Achievement for the Five Selected Country Programs

Source: Independent Evaluation Group.
Note: t-SNE = t-distributed stochastic neighbor embedding; WASH = water, sanitation, and hygiene.
It is important to note that our pilot text classifier model cannot yet be considered automated. This is because it was trained and tested on text that was manually extracted into correspondence tables by World Bank IEG experts. To avoid this manual and time-consuming step, a model that can identify, extract, and format content of interest ready for labeling directly from raw project documents would need to be built.
The effectiveness of NLP in doing this will be affected by the quality of the documents being read. Inappropriate pagination, inconsistent chapter headings, unusual text formatting, and so on would degrade the performance of the text extraction. Given these intricacies, developing an algorithm that identifies content of interest for labeling was out of the scope of this pilot.
However, IEG has now developed an automated document section extraction routine that can identify and extract specific sections from raw documents with a high degree of accuracy. Combining this approach with the text classifier model could help overcome the manual step of extracting text of interest before labeling, thus bringing the approach closer to wider-scale automated label prediction. This should be explored further in subsequent research.
Can Unsupervised Machine Learning Offer New and Important Emergent Insights into Project Data?
The second learning goal was to determine whether UML using topic modeling could generate new and important emergent insights from a large data set. The data set used for the topic model included all text classified under the “factors affecting success or failure” label category. These data were chosen for the pilot because they represented an opportunity to determine whether topic modeling could be used to generate new knowledge from this important data set without the use of more resource-intensive manual methods.
Inductive approaches like topic models or traditional ground-up analyses make no prior hypotheses or expectations of what themes or topics will be found within the data. Instead, topics are identified or emerge from the data while the content is being read. As such, inductive approaches are exploratory and hypothesis generating (What themes will be found in the data and how might they be important?), and deductive approaches are confirmatory (What evidence is there that intervention X affects project outcomes through mechanism Y?).
Our first analysis involved performing topic modeling and t-SNE visualization on all the data in the “factors affecting success or failure” category (for topic modeling, see Whye Teh et al. 2006; Sai-hung and Flyvbjerg 2020). By pooling both the success factors and failure factors we could explore whether there were any common themes or relationships between success and failure factors, such as the failure factors being the inverse or absence of success factors.
The topic model algorithm clusters the success and failure factor data together and extracts statistically significant guide words for each cluster. Texts with the highest scores against the guide words in each cluster were then selected. These prime examples of guide word text were then reviewed by a domain-specific expert to determine if they represented a coherent topic. The expert then used their domain-specific knowledge and the model-provided guide words to interpret the content and develop topic descriptors. These topic descriptors therefore represent factors that are hypothesized to be important to both the success and failure of projects. The 10 topics identified through the topic modeling and their hypothesized topic descriptors are presented in table 3.2.
Once the topics were validated, they were mapped as data points in a continuous space using a t-SNE model to visualize similarity among topics. Simply put, the closer topics are to each other, the more meaning they have in common. But by preserving a holistic view, as opposed to a one-to-one comparison, we can see that the different clusters vary smoothly over the space in a continuous way. This allows graduations in meanings to be interpreted. The results of the t-SNE visualization are shown in figure 3.3.
As can be seen in figure 3.3, topics running in a north-south direction (y-axis) tend to transition from underlying sociopolitical themes to more technical themes. Topics running in an east-west direction (x-axis) tend to transition from project-specific themes to more contextual country- or system-specific themes. Proceeding clockwise from topic 1, the topics also approximately correspond to the key elements of a project implementation cycle, especially when topics are grouped into broader quadrants.
The performance of the topic model in generating such coherent and domain-relevant inductive topics is very promising, especially given that the inductive topics were novel and provided greater depth to the analysis than was originally envisaged within the predetermined labels of the deductive SML approach.
Table 3.2. Artificial Intelligence–Identified Inductive Topics and Their Hypothesized Topic Descriptors
|
Topic 1 |
Topic 2 |
Topic 3 |
Topic 4 |
Topic 5 |
|
Systems, Procurement, Monitoring, Budgets |
Outcome Ratings, Revising, Objectives |
Operations, Communication, Finance |
Coordination, Timeliness, Gender |
Donors, Finance, Community, Service Providers |
|
Program Design and Setup |
Adaptive Management |
Performance Improvement Strategies |
Implementation |
Risks |
|
|
|
|
|
|
Topic 6 |
Topic 7 |
Topic 8 |
Topic 9 |
Topic 10 |
|
Capacity, Quality, Risk |
M&E |
Local, Community, and Social Context and Services |
Implementing Agency Performance, Coordination, Staff |
World Bank and Government Performance, Political Commitment and Stability, Indicators |
|
Risk Mitigation |
Leadership and Management |
Operations |
Sustainability Factors |
Evaluation and Performance Review |
|
|
|
|
|
Source: Independent Evaluation Group.
Note: Artificial intelligence–identified inductive topics are shown in gray rows and their hypothesized topic descriptors are shown in blue rows. KPI = key performance indicator; M&E = monitoring and evaluation
The spatial visualization also shows significant value added in terms of its insights, not just over deductive approaches but also over traditional inductive approaches, which would have struggled to identify these patterns.
As a secondary analysis, we performed topic modeling on the data labeled as “success factors” and “failure factors” separately (Chapman and Quang, 2021). This was to determine whether the success factor data and failure factor data share common topic descriptors and guide words within the 10 topics or whether themes within the 10 topics are specific to either success or failure. This analysis also allows us to check whether the 10 topics identified in the pooled analysis comprehensively explained all the data, or whether additional, unidentified topic clusters may emerge. This is best practice in traditional thematic analysis, where the goal is to reach thematic saturation.
Figure 3.3. t-SNE Visualization of Artificial Intelligence–Identified Inductive Topics and Hypotheses for Spatial Patterns

Figure 3.3. t-SNE Visualization of Artificial Intelligence–Identified Inductive Topics and Hypotheses for Spatial Patterns

Source: Independent Evaluation Group.
Note: t-SNE = t-distributed stochastic neighbor embedding.
When topics were analyzed as separate cohorts, no new topic clusters emerged. This confirmed that the analysis had reached thematic saturation. As hypothesized, the success factor data and failure factor data were not distinct within topics. Instead, the two sets of data shared strong similarities and overlaps, confirming that the failure factors were essentially the inverse or absence of success factors. This also explains why the 10 topics in the pooled analysis explained all the data. For instance, the largest cluster in the failure factor data included topics related to misalignment of project designs to country contexts, overly optimistic objectives, insufficient local coordination, civil instability, and natural disasters. This failure factor topic is covered by topic 5 in the pooled analysis and is the opposite of a success factor topic.
This observation lends itself to the hypothesis that the 10 topics represent prerequisites, conditions, and actions that are necessary for project success; when they are in place, projects usually succeed; when they are not in place, projects often fail.
It may seem remarkable that such an important hypothesis can be generated through a UML model with no guidance except for labeling texts as success factors or failure factors. However, this hypothesis appeared highly plausible given the obvious alignment among the 10 topics and widely recognized good practices for international development programs (Ika, Diallo and Thuillier, 2021; Ika and Donnelly, 2017). As suggested by our topic model, the international development community also regards these good practices as prerequisites for program success.
Subsequent statistical analyses performed by IEG found that the UML-identified topics turned out to be key predictors of project performance, as measured by nutrition indicator achievement. This confirmed the usefulness of topic modeling for identification of success factors, providing supporting empirical evidence for good practices in international development. Since these factors were identified at the project rather than the intervention level, this exercise can likely be replicated in other thematic evaluations.
In our final analysis, we explored whether project-specific characteristics determined the importance of any of the 10 prerequisites for project success and ultimately the likelihood that the project would achieve its objectives. It was hypothesized that the multidimensionality of a project may be an important characteristic in determining challenges faced and project success. Therefore, we calculated a multidimensionality score for each project, which measured the variety of interventions used to tackle stunted growth and chronic malnutrition; the higher the score, the more interventions applied.
Using t-SNE clustering that analyzed success and failure factors separately, we found that clusters relating to topics 3, 7, and 9 were common across the full range of multidimensionality scores. However, clusters relating to topics 1, 4, 6, and 8 were particularly prominent in projects with low multidimensionality scores. This suggests that performance improvement strategies (topic 3), monitoring and evaluation (topic 7), and sustainability factors (topic 9) are universally important. But projects that use a limited number of interventions should pay particular attention to project design and setup (topic 1), implementation (topic 4), risk mitigation (topic 6), and operations (topic 8).
The potential importance of using different project management strategies depending on the multidimensionality of the project is supported by further analysis that showed that high- and low-dimensional projects had different success and failure factors in common, particularly those relating to institutional strengthening.
This demonstrates that although the topics for success factors and failure factors all fall within the 10 prerequisites for project success, the project-specific factors affecting success do vary by multidimensionality. However, although we observed a positive relationship between multidimensionality score and outcome indicator achievement, this was not statistically significant. Therefore, we cannot conclude that projects with a greater variety of interventions are more likely to be successful.
Overall, the UML approach showed excellent performance in identifying inductive topics that were not only coherent and domain relevant but also novel and insightful. This added extra depth to the SML analysis, including identifying patterns that a human-generated analysis may have missed. The key advantage of the topic modeling or UML approach is its scalability. Manual inductive analyses can be very time-consuming, which means that they are often limited in the number of documents they can include.
Although the UML approach required significant time investment to extract text of interest for the topic model, the analytical work and interpretation of the outputs was completed very quickly. Therefore, although topic modeling or UML may not result in significant time savings for smaller studies, it quickly becomes advantageous for larger studies. If the process becomes more automated, these time savings could become even more significant.
However, the reality is that UML approaches will always be dependent on and strengthened by deploying them in tandem with manual methods. Traditional approaches are needed to provide the domain expertise to identify the need for a topic model through in-depth smaller studies and to interpret and report the output. The AI approach then offers the analytical power to scale these studies beyond the possibilities of normal qualitative analyses.
Can Knowledge Graphs Organize Data into a Theory of Change and Help Determine Program Contribution?
The final learning goal was to understand the potential of knowledge graphs to structure machine learning outputs according to a ToC and enable a theory-based evaluation of program performance.
Within the field of evaluation, knowledge graphs could act as a smart ToC to streamline the portfolio review process by facilitating retrieval and interrogation of multiple sources of evidence on a specific domain of interest. For instance, content on intervention performance that has been coded by machine learning can be mapped onto a knowledge graph schema based on the program ToC. Evidence on each component of the ToC can then be reviewed, compared, and analyzed for causal relationships, thus helping to determine program contribution and answer evaluation questions.
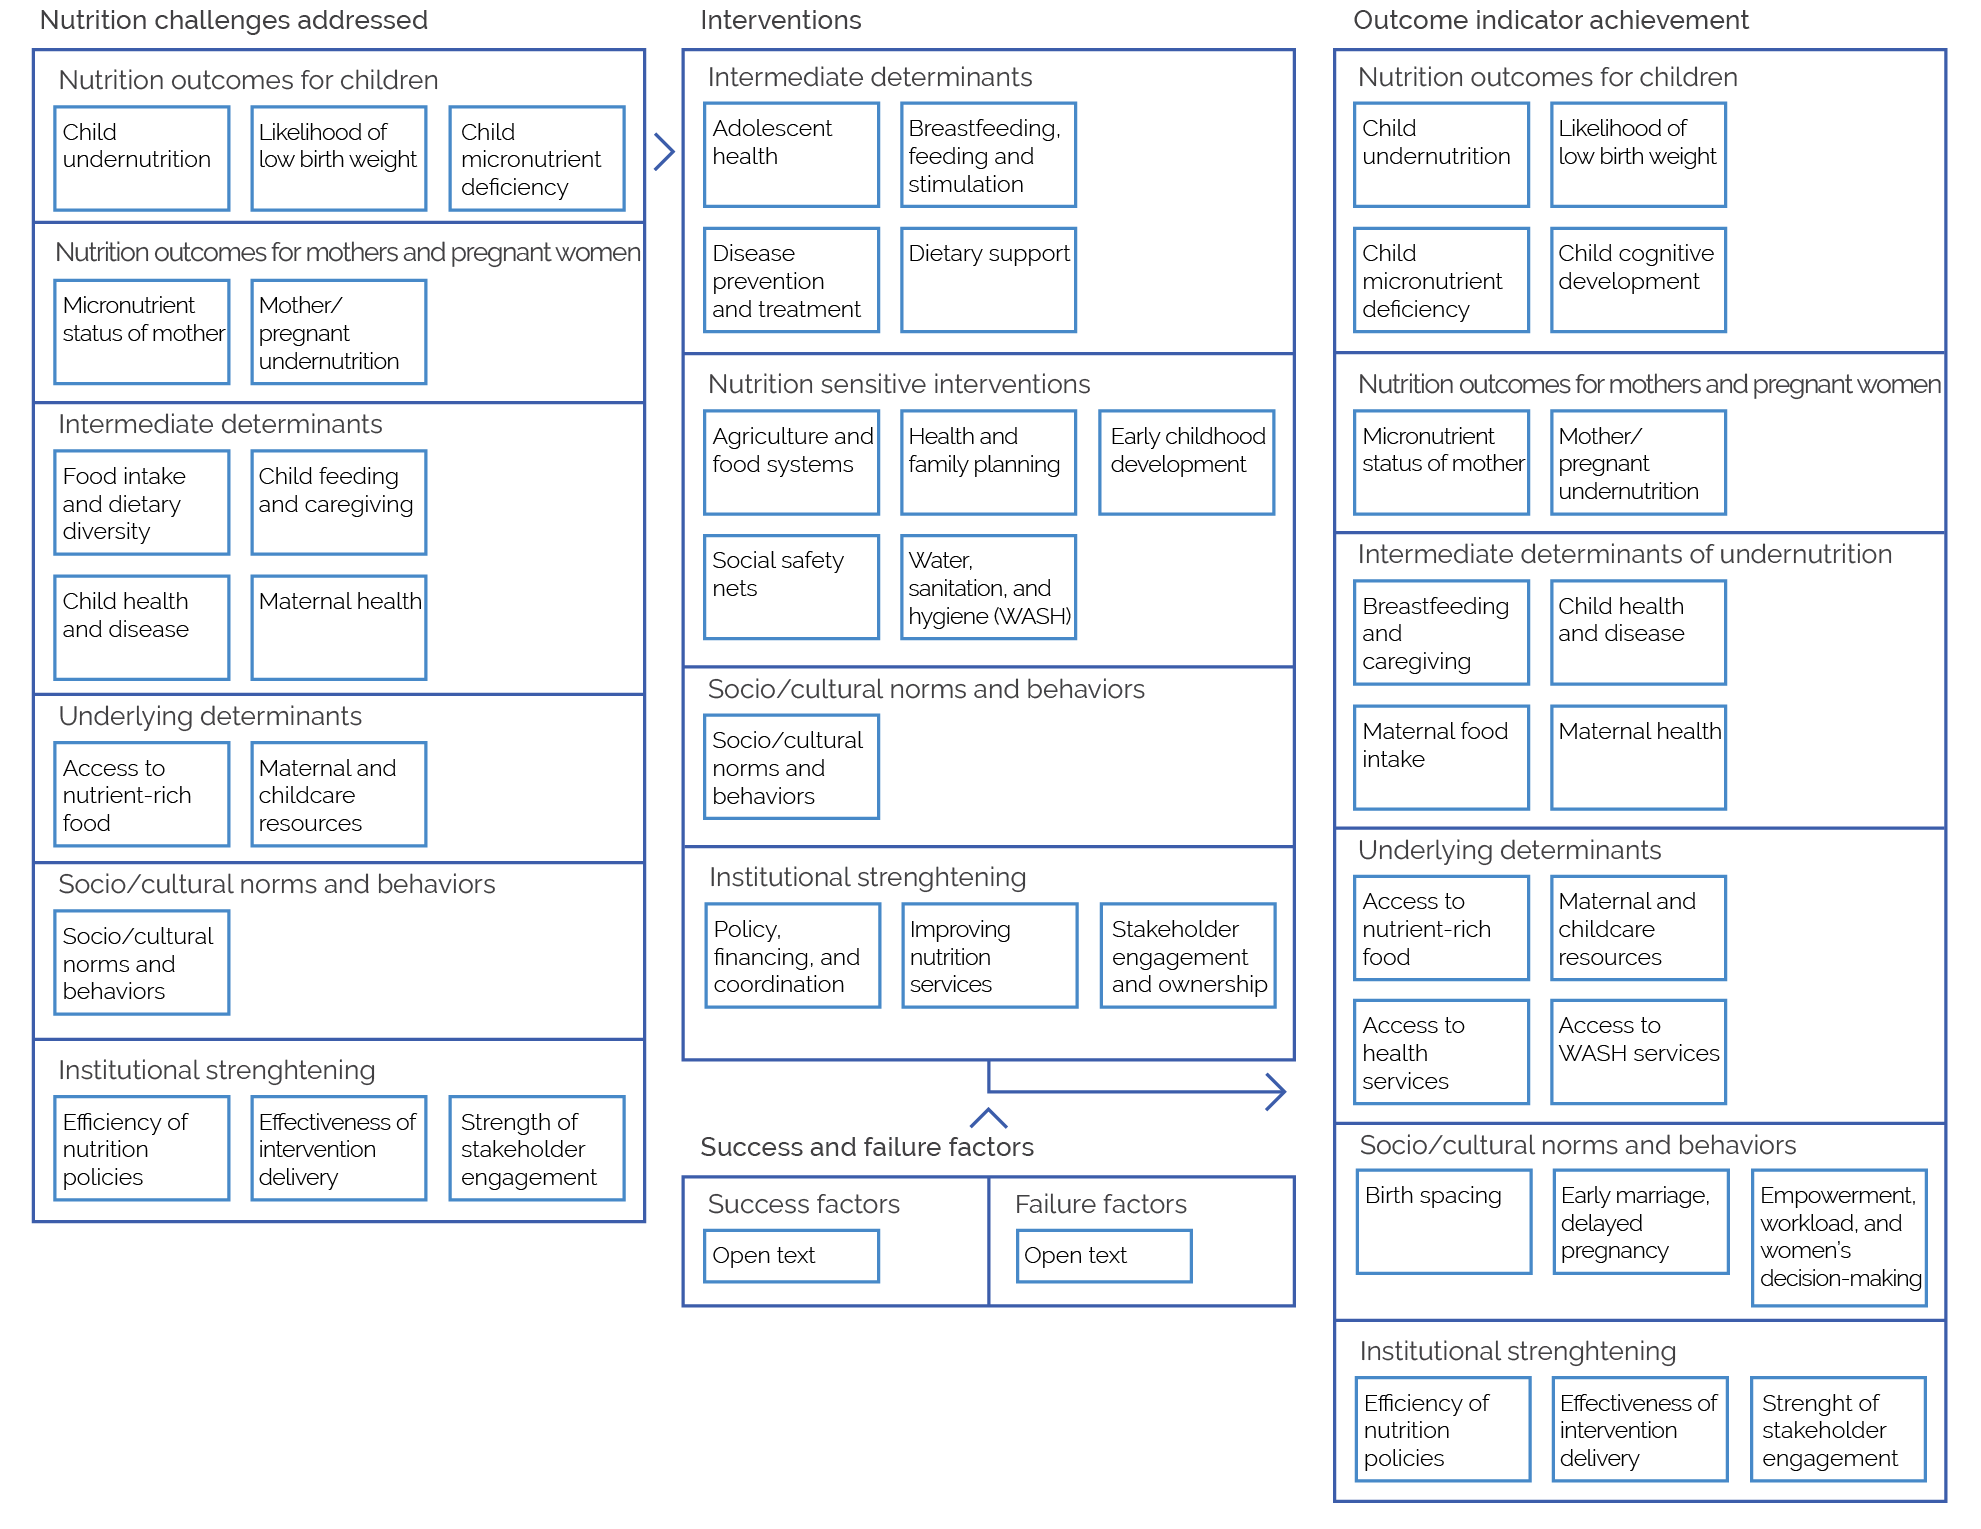
To undertake these analyses, we needed to develop a knowledge graph schema that mapped the semantic relationships between key categories of the data to corresponding concepts in the stunted growth and chronic malnutrition ToC. Arranging the data into this logical flow was a simple exercise because the machine learning labels already represented components of the ToC: nutrition challenges addressed, interventions, outcome indicator achievement, and factors affecting success or failure. A high-level diagrammatic representation of the knowledge graph schema, or ontological model, is presented in figure 3.4.
Once the conceptual pathways between label categories were established, data from the machine learning outputs were used to generate a knowledge graph. This smart ToC can be statistically interrogated to directly explore relationships in the data that might suggest contributing factors. Analyses can also be run to provide evidence for programmatic decision-making or specific evaluation questions.
In this pilot, we focused on identifying success rates of different interventions at country and regional levels. The performance of interventions was tested by identifying the outcomes that an intervention was hypothesized to result in (as per the conceptual framework), and then testing whether the outcome’s indicator was labeled as achieved or not achieved.
Figure 3.4. High-Level Diagrammatic Representation of the Knowledge Graph Schema

Figure 3.4. High-Level Diagrammatic Representation of the Knowledge Graph Schema
Source: Independent Evaluation Group.
Note: WASH = water, sanitation, and hygiene.
This kind of pattern mining uses Vadalog rule-based reasoning to test the rule “when outcome = X and intervention = Y, indicator achievement = achieved.” Each rule has a confidence, which represents the ratio of how often the rule has been found to be true. For example, figure 3.5 shows that the outcome “strengthened stakeholder engagement and ownership” has been achieved in 78 percent of the cases when “stakeholder engagement and ownership” interventions are used.
Figure 3.5. Rule-Based Pattern Mining

Figure 3.5. Rule-Based Pattern Mining

Source: Independent Evaluation Group.
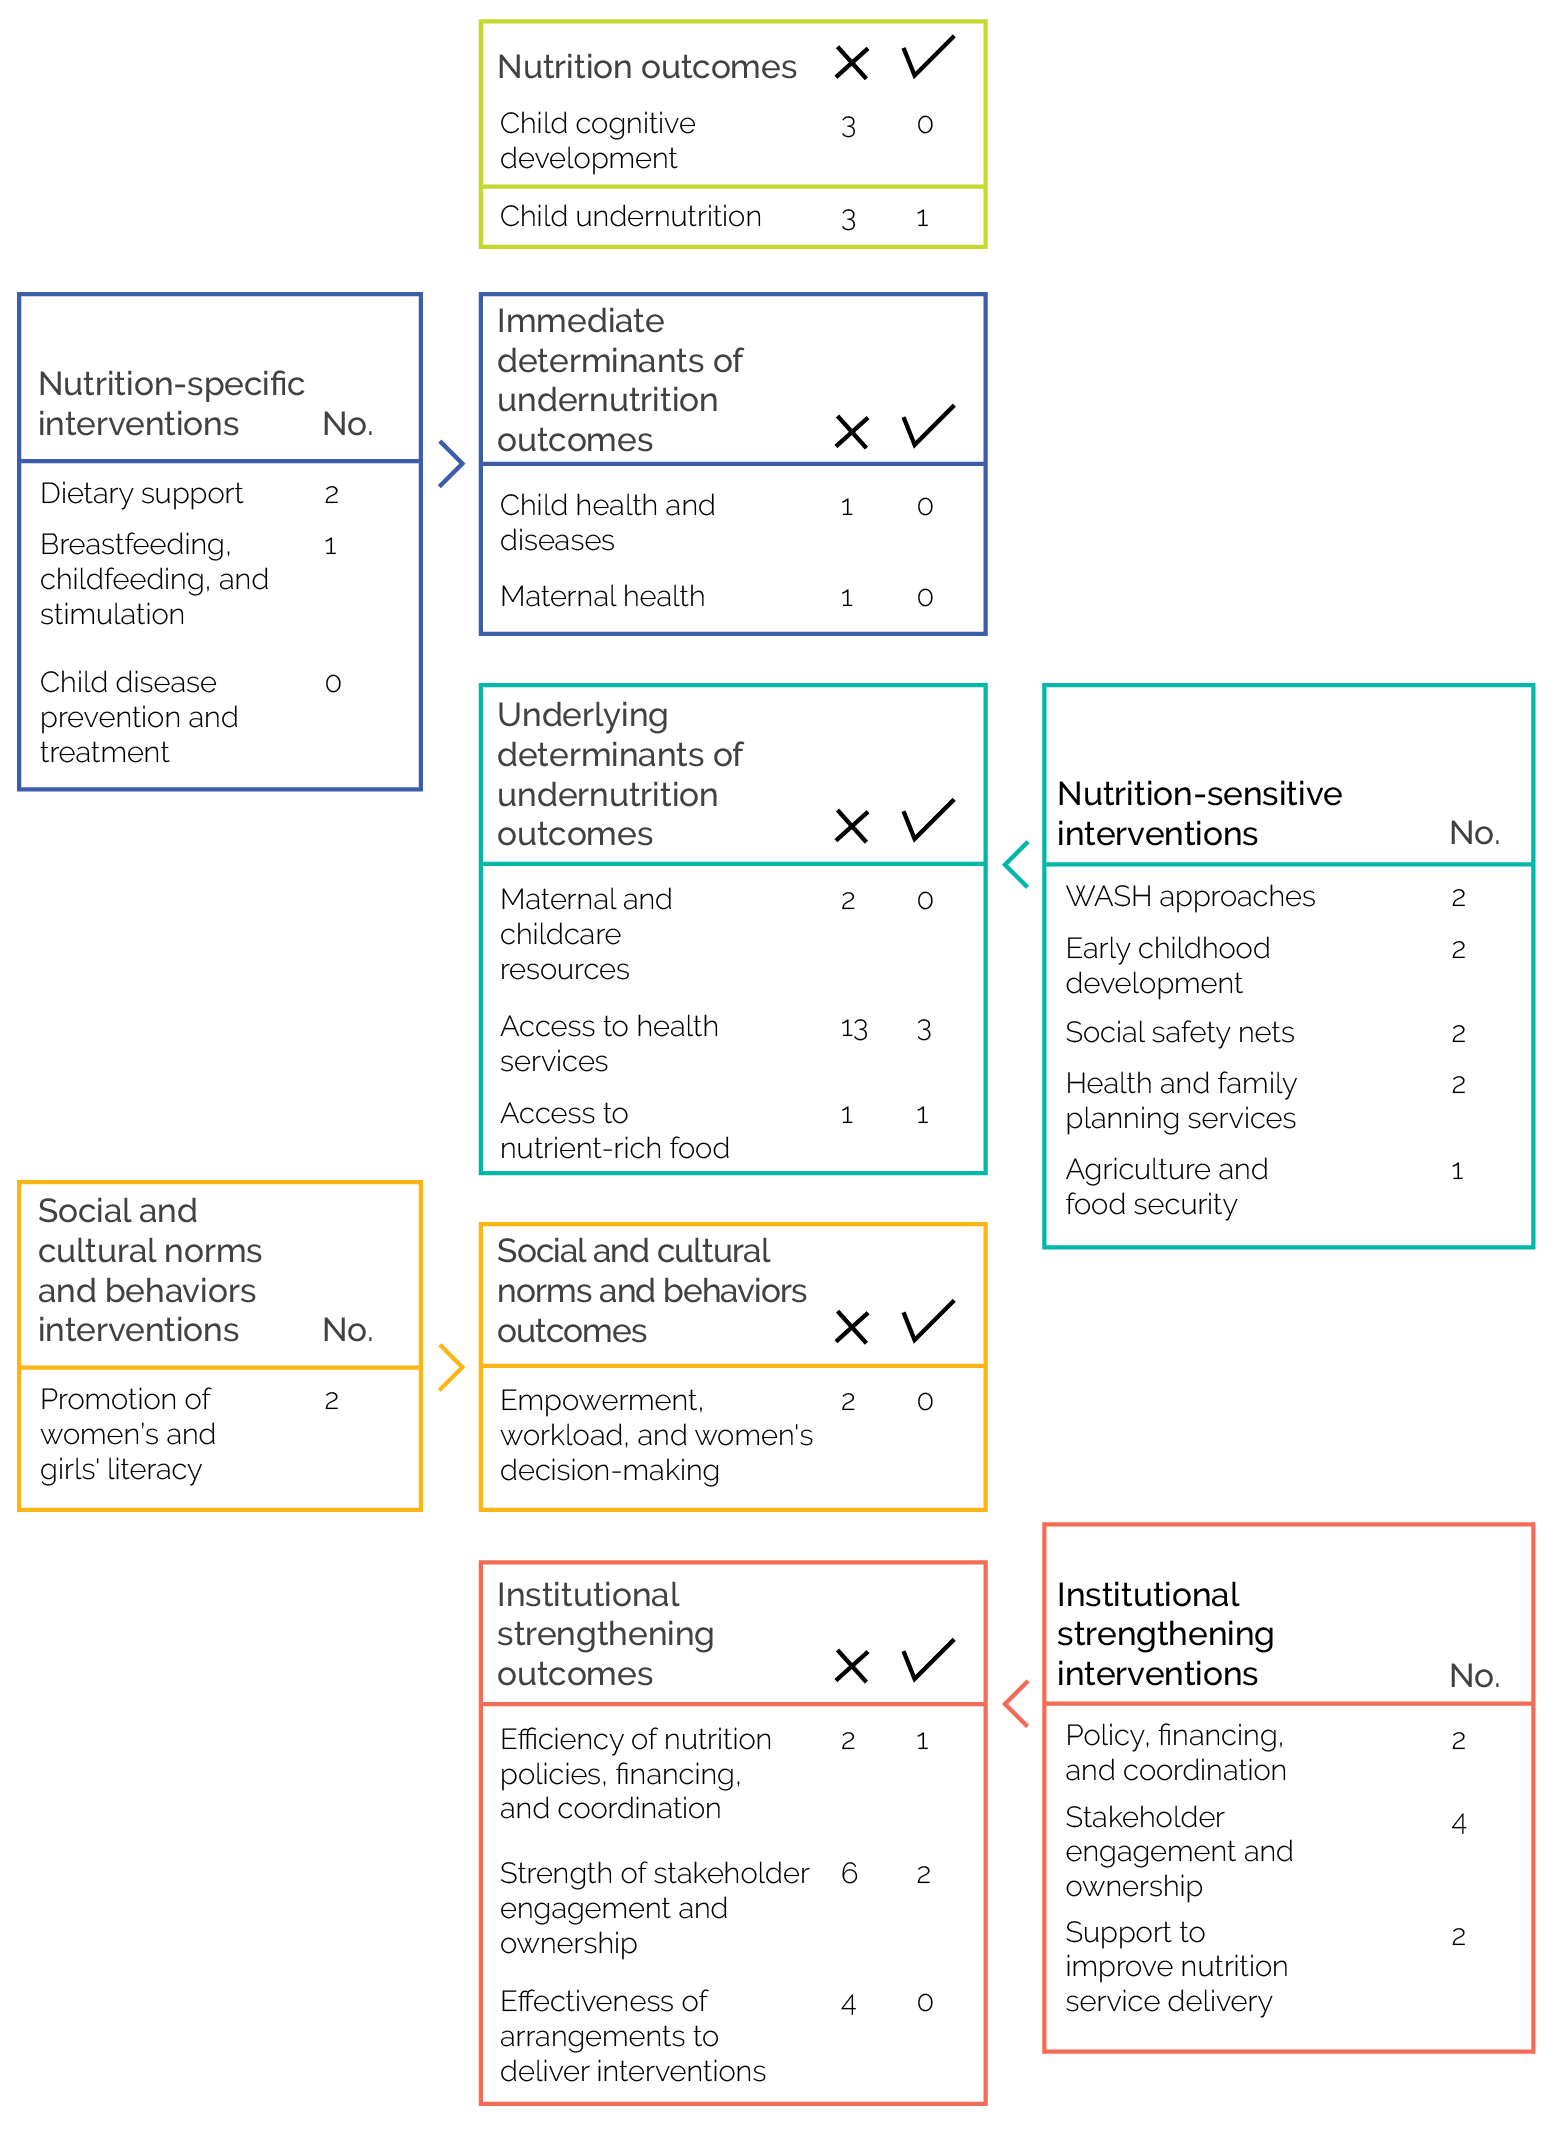
The results from a similar set of knowledge graph queries on all closed projects in the pilot country data set are presented in figure 3.6.
This initial investigation was limited to specific pairings between interventions and outcomes. Therefore, although we can determine if interventionX from projectY resulted in outcomeZ, this offers limited insight into the totality of outcomes that a project or intervention may have achieved. This is because, in reality, the data are more complex. One intervention may have multiple outcome indicators with different achievement status, and outcome indicators are not mutually exclusive because the same indicator label can be targeted by different interventions.
This multilabel complication can be overcome through the development of more granular labels and knowledge schema based on a more detailed ToC. This would enable the mapping of more specific relationships among nutrition challenges addressed, interventions, and outcome indicator achievement. This is similar to the context, mechanism, and outcome configurations used in realist analysis to determine program contribution. Other labels could be added to provide evidence on intervention delivery such as implementation fidelity.
Figure 3.6. Interventions and Outcome Achievement Status for Closed Projects in the Pilot Country Portfolio

Figure 3.6. Interventions and Outcome Achievement Status for Closed Projects in the Pilot Country Portfolio
Source: Independent Evaluation Group.
Note: Data from active projects are not included. One project may employ multiple interventions, and one intervention may have several outcomes. WASH = water, sanitation, and hygiene.
In this pilot, indicator achievement status had to be identified from a separate internal database containing baseline, target, and final values because project reports did not explicitly state outcomes for each indicator. This meant that a more granular labeling approach would be too time-consuming.
However, future work could explore the possibility of a classifier model being trained to read logframes or other similar outcome frameworks. This could enable automated capture of quantitative results and outcome achievement status, making it feasible to populate a more granular knowledge schema. The inclusion of quantitative results could also help establish the size of outcome achievements and may provide benchmarks for comparing projects.
If successful, such logframe analyses could open possibilities for tracking project implementation status and highlighting risks. Similar AI-enabled project management systems are routinely used in the infrastructure sector to predict projects at risk of failure but have not been adopted in the development sector despite increasing project size, budgets, and complexity.
Currently, our knowledge graph is useful for structuring and exploring simple patterns in machine learning outputs that could be used to provide evidence for evaluations on intervention effectiveness and program contribution. However, one of the key outstanding challenges is dealing with incomplete evidence linking elements of the conceptual framework. For instance, an intervention may not have achieved its original objective but may have resulted in alternative outcomes, or project adaptation may make outcome pathways harder to trace. This incomplete evidence trail can make it difficult to build a unified knowledge graph because different parts of the network can be left stranded or orphaned from logical precursors or successors.
It is possible that additional data could be added to the knowledge graph, or graph reasoning methods could be used to populate missing nodes or identify alternative pathways—much like how an expert human evaluator would approach this problem. But as in traditional approaches, it would take time to build a more granular schema that incorporates all causal paths and the output of the knowledge graph will always depend on the breadth, depth, and quality of available data.