
Results and Performance of the World Bank Group 2021
Chapter 2 | World Bank Results and Performance
The World Bank’s project outcome ratings increased substantially in FY20. This increase, which occurred for all categories of projects, extends the World Bank’s positive ratings trend from the past several years. The analysis found that these improved ratings are compatible with selective risk taking that derives from introducing novelty into projects. This chapter also finds that ratings increases are consistent with improvements to monitoring and evaluation (M&E) quality, although the World Bank’s outcome indicators and targets do not always robustly measure development results.
The Fiscal Year 2020 Ratings Increase
The World Bank saw a recent jump in project outcome ratings for all project categories in FY20; if confirmed,1 this increase would be the steepest of the past five years. This section presents trends and explores several factors associated with World Bank project performance,2 as identified in previous RAPs and the broader literature, such as a project’s size, lending group, fragile and conflict-affected situation (FCS) status, quality at entry, and M&E quality. Some of these factors correlate with the positive change in ratings but do not explain the extraordinary jump in FY20.
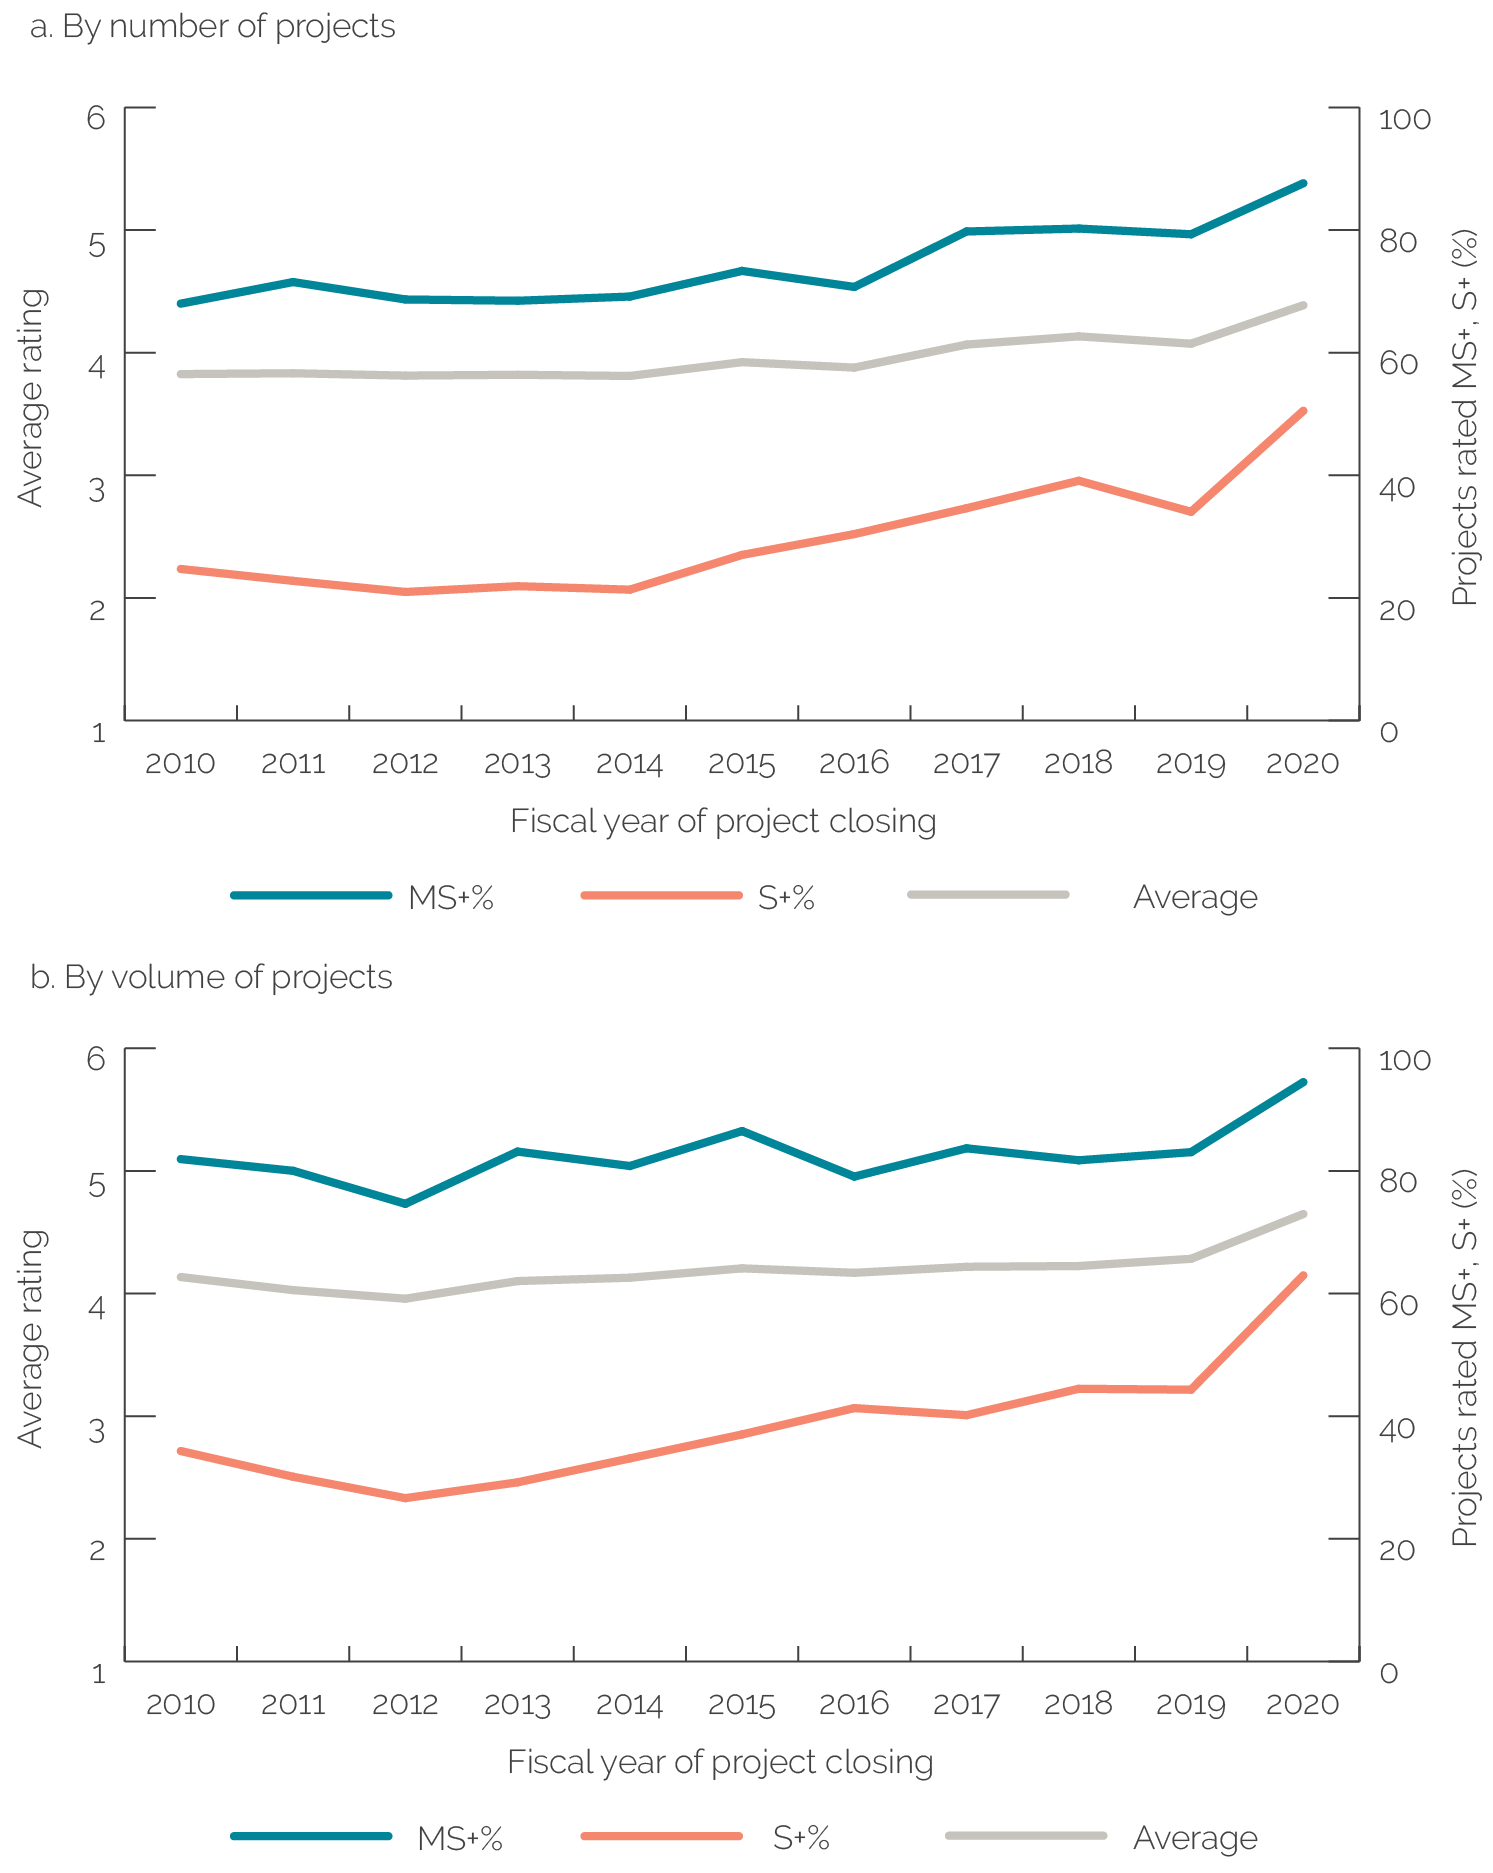
The World Bank’s project outcome ratings improved dramatically from FY19 to FY20. This jump in ratings occurred for both average project outcome ratings, which increased from 4.1 to 4.4 on a scale of 1 to 6 (figure 2.1, panel a, gray line), and percentage of projects with outcome ratings of moderately satisfactory or above (MS+), which increased from 79 percent to 88 percent (figure 2.1, panel a, blue line). This annual increase was the largest over the past five years.3 The increase was similar whether measured by the volume of projects (figure 2.1, panel b) or by the number of projects (figure 2.1, panel a).
Figure 2.1. World Bank Project Outcome Ratings

Source: Independent Evaluation Group.
Note: The left-hand axis represents the ratings scale for outcome ratings of World Bank projects, in which 1 represents a rating of highly unsatisfactory, 2 unsatisfactory, 3 moderately unsatisfactory, 4 moderately satisfactory, 5 satisfactory, and 6 highly satisfactory. The right-hand axis represents the percentage of projects with outcomes rated MS+ or S+. MS+ = moderately satisfactory or above; S+ = satisfactory or above.
Figure 2.1. World Bank Project Outcome Ratings
Source: Independent Evaluation Group.
Note: The left-hand axis represents the ratings scale for outcome ratings of World Bank projects, in which 1 represents a rating of highly unsatisfactory, 2 unsatisfactory, 3 moderately unsatisfactory, 4 moderately satisfactory, 5 satisfactory, and 6 highly satisfactory. The right-hand axis represents the percentage of projects with outcomes rated MS+ or S+. MS+ = moderately satisfactory or above; S+ = satisfactory or above.
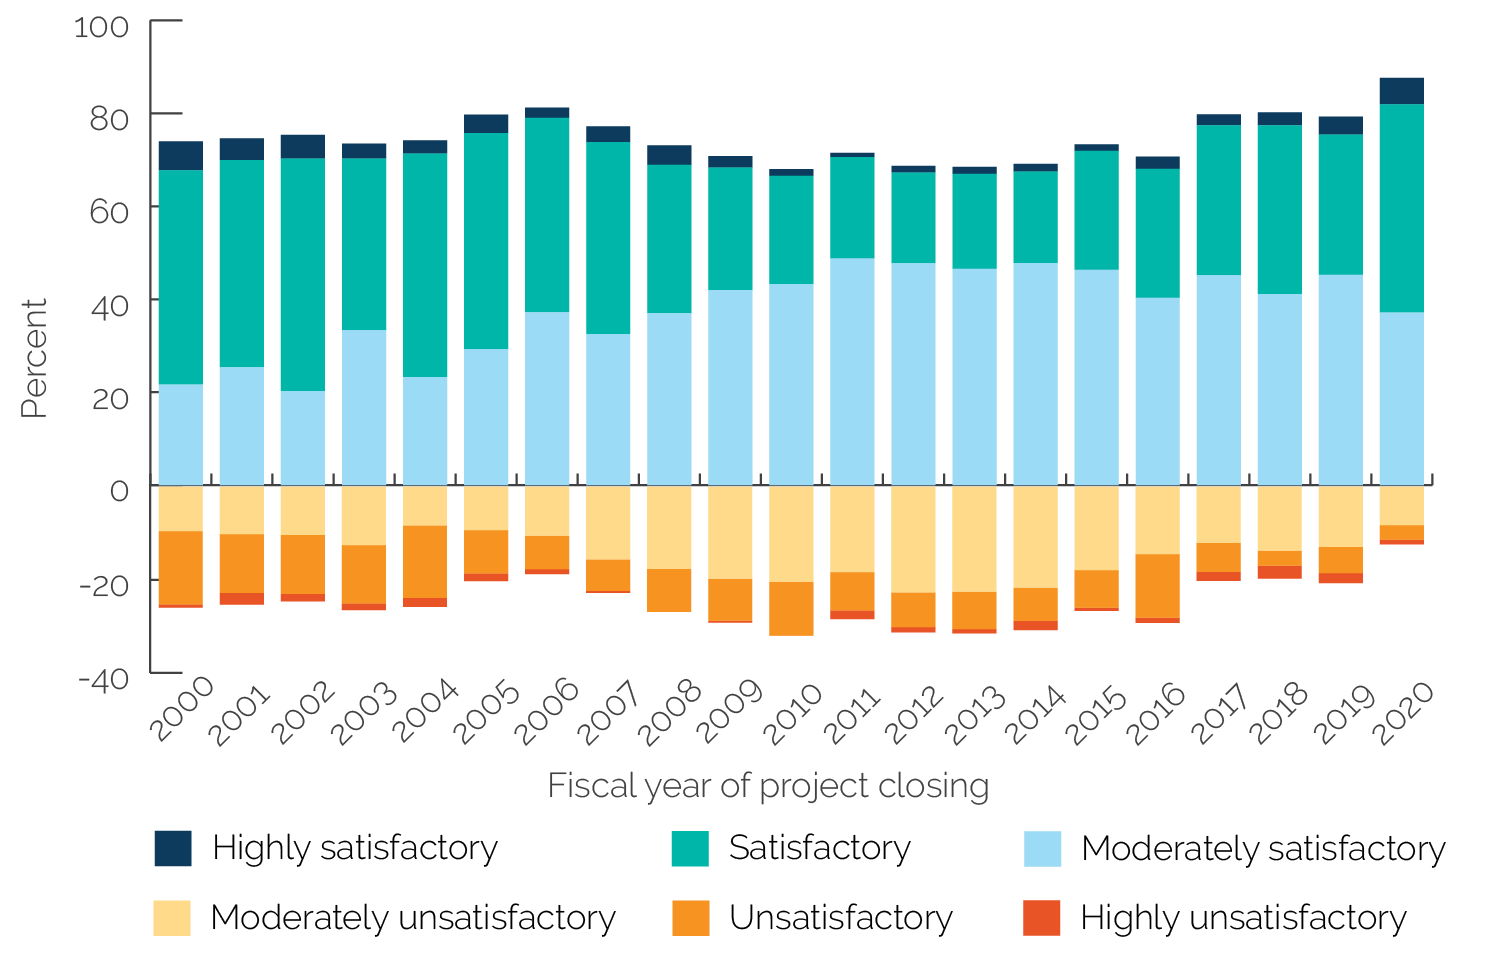
The increase in the percentage of projects rated satisfactory and highly satisfactory was especially steep. The increase in the percentage of projects whose outcome ratings were satisfactory or above (S+; figure 2.1, panel a, red line) climbed from 34 percent in FY19 to 51 percent in FY20. Nearly 6 percent of projects that closed in FY20, with ICRs submitted and validated by IEG, were rated highly satisfactory, the highest since 2001. Moreover, only 1 percent of FY20 projects were rated highly unsatisfactory, and 3 percent were rated unsatisfactory. Figure 2.2 shows that, essentially, the bottom tail in the ratings distribution is disappearing, whereas the top tail is thickening.
Figure 2.2. Distribution of the World Bank’s Project Outcome Ratings

Source: Independent Evaluation Group.
Figure 2.2. Distribution of the World Bank’s Project Outcome Ratings
Source: Independent Evaluation Group.
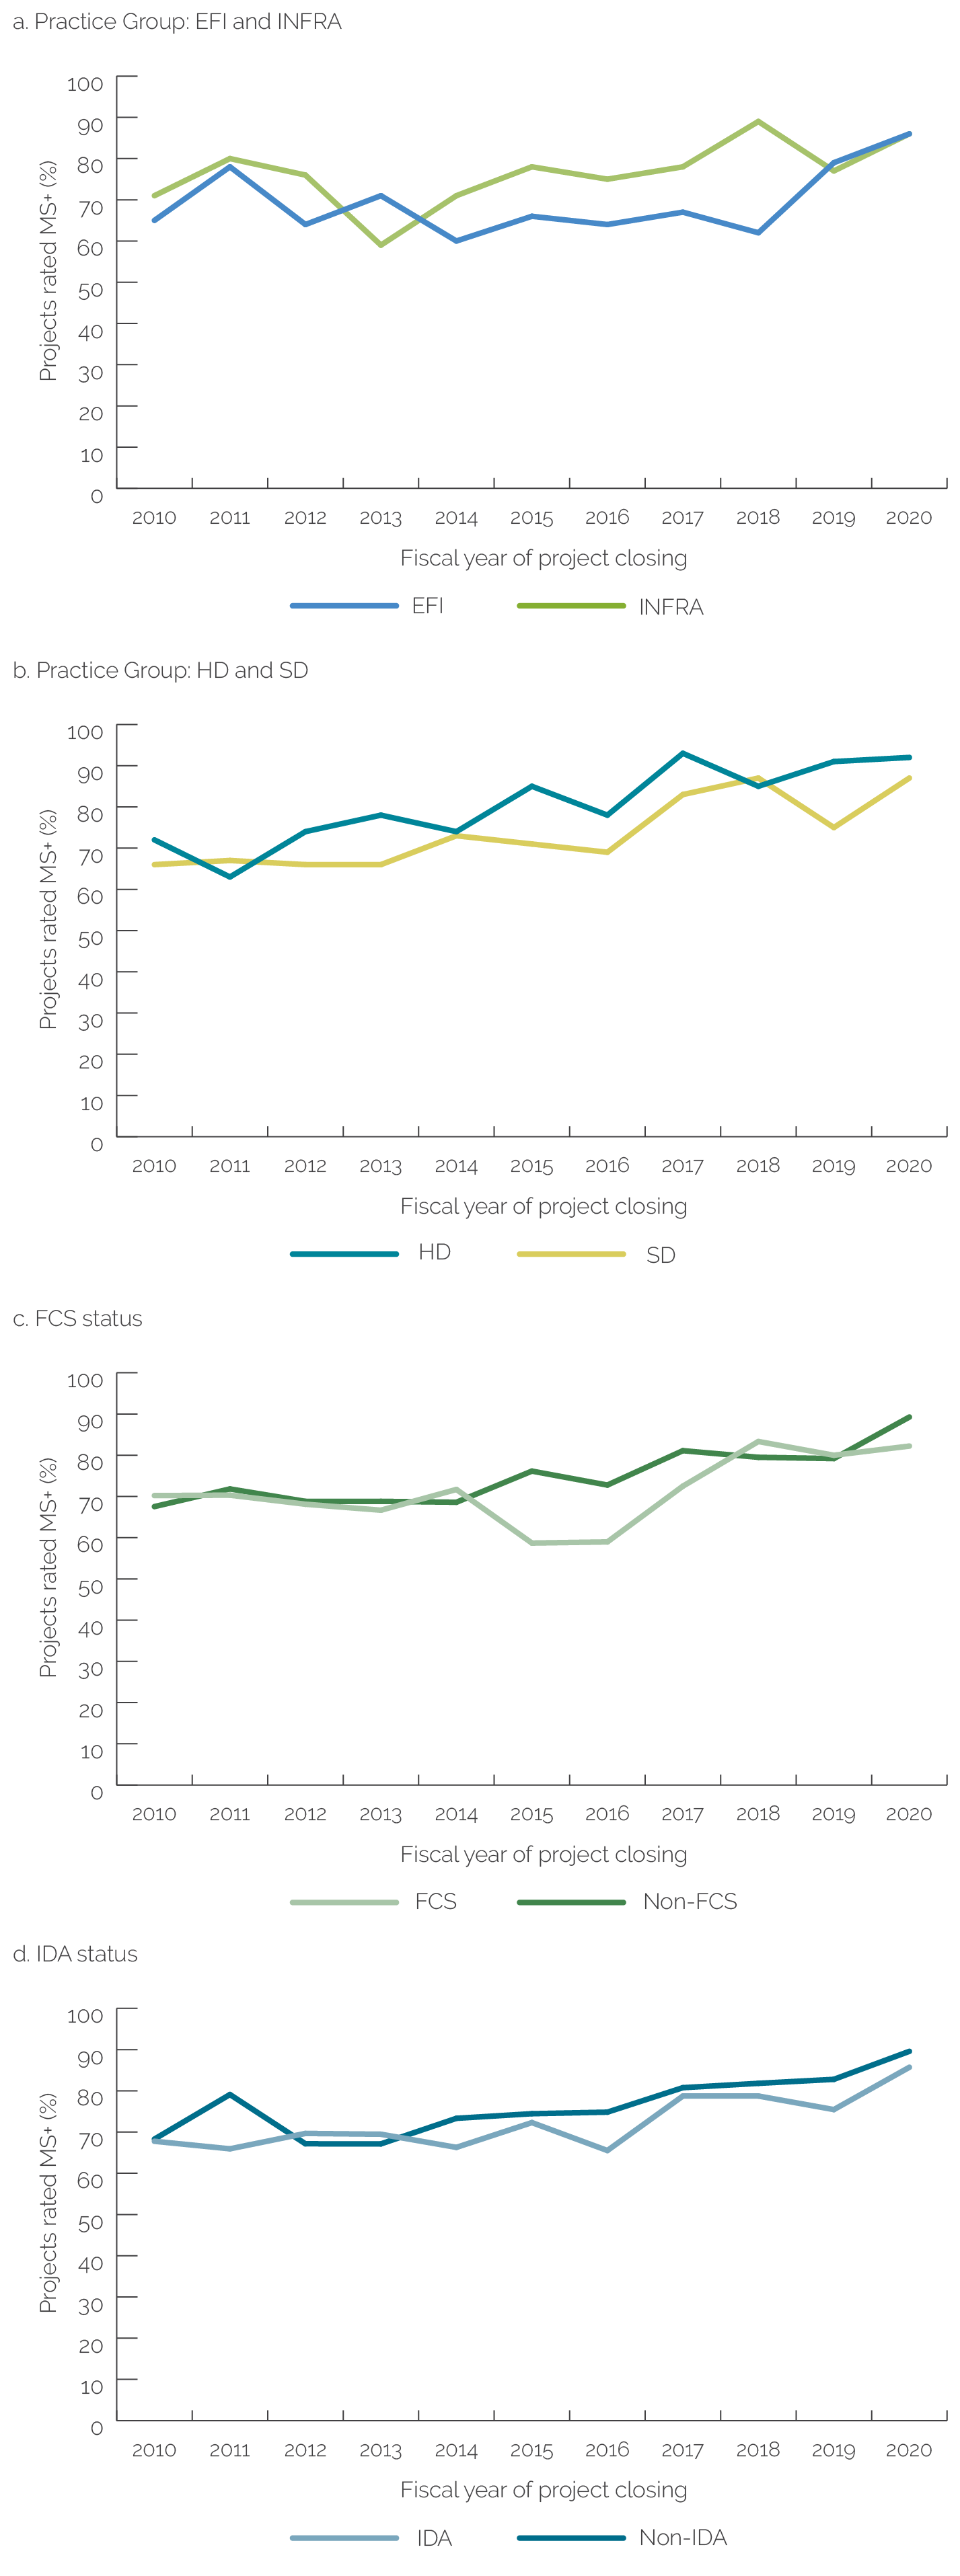
Ratings increased for projects in all Practice Groups, and the increase was especially steep for Sustainable Development projects. The percentage of Sustainable Development projects with project outcomes rated MS+ increased from 75 percent, the lowest among the four Practice Groups, in FY19, to 87 percent, the second highest, in FY20.4 Sustainable Development projects also increased their share in the overall portfolio, from 38 to 48 percent of all projects. By contrast, the percentage of Human Development projects rated MS+ increased very little, from 91.1 to 91.7 percent, although Human Development still has the highest-rated projects of all Practice Groups (figure 2.3, panels a and b). This RAP’s decomposition analysis, presented in figure 2.4, shows that Sustainable Development’s increase offsets the shrinking portfolio shares of the Infrastructure and Equitable Growth, Finance, and Institutions Practice Groups, which also had positive ratings increases.5
Figure 2.3. Projects Rated Moderately Satisfactory or Above for Select World Bank Project Categories

Source: Independent Evaluation Group.
Note: EFI = Equitable Growth, Finance, and Institutions; FCS = fragile and conflict-affected situation; HD = Human Development; IDA = International Development Association; INFRA = Infrastructure; MS+ = moderately satisfactory or above; SD = Sustainable Development.
Figure 2.3. Projects Rated Moderately Satisfactory or Above for Select World Bank Project Categories
Source: Independent Evaluation Group.
Note: EFI = Equitable Growth, Finance, and Institutions; FCS = fragile and conflict-affected situation; HD = Human Development; IDA = International Development Association; INFRA = Infrastructure; MS+ = moderately satisfactory or above; SD = Sustainable Development.
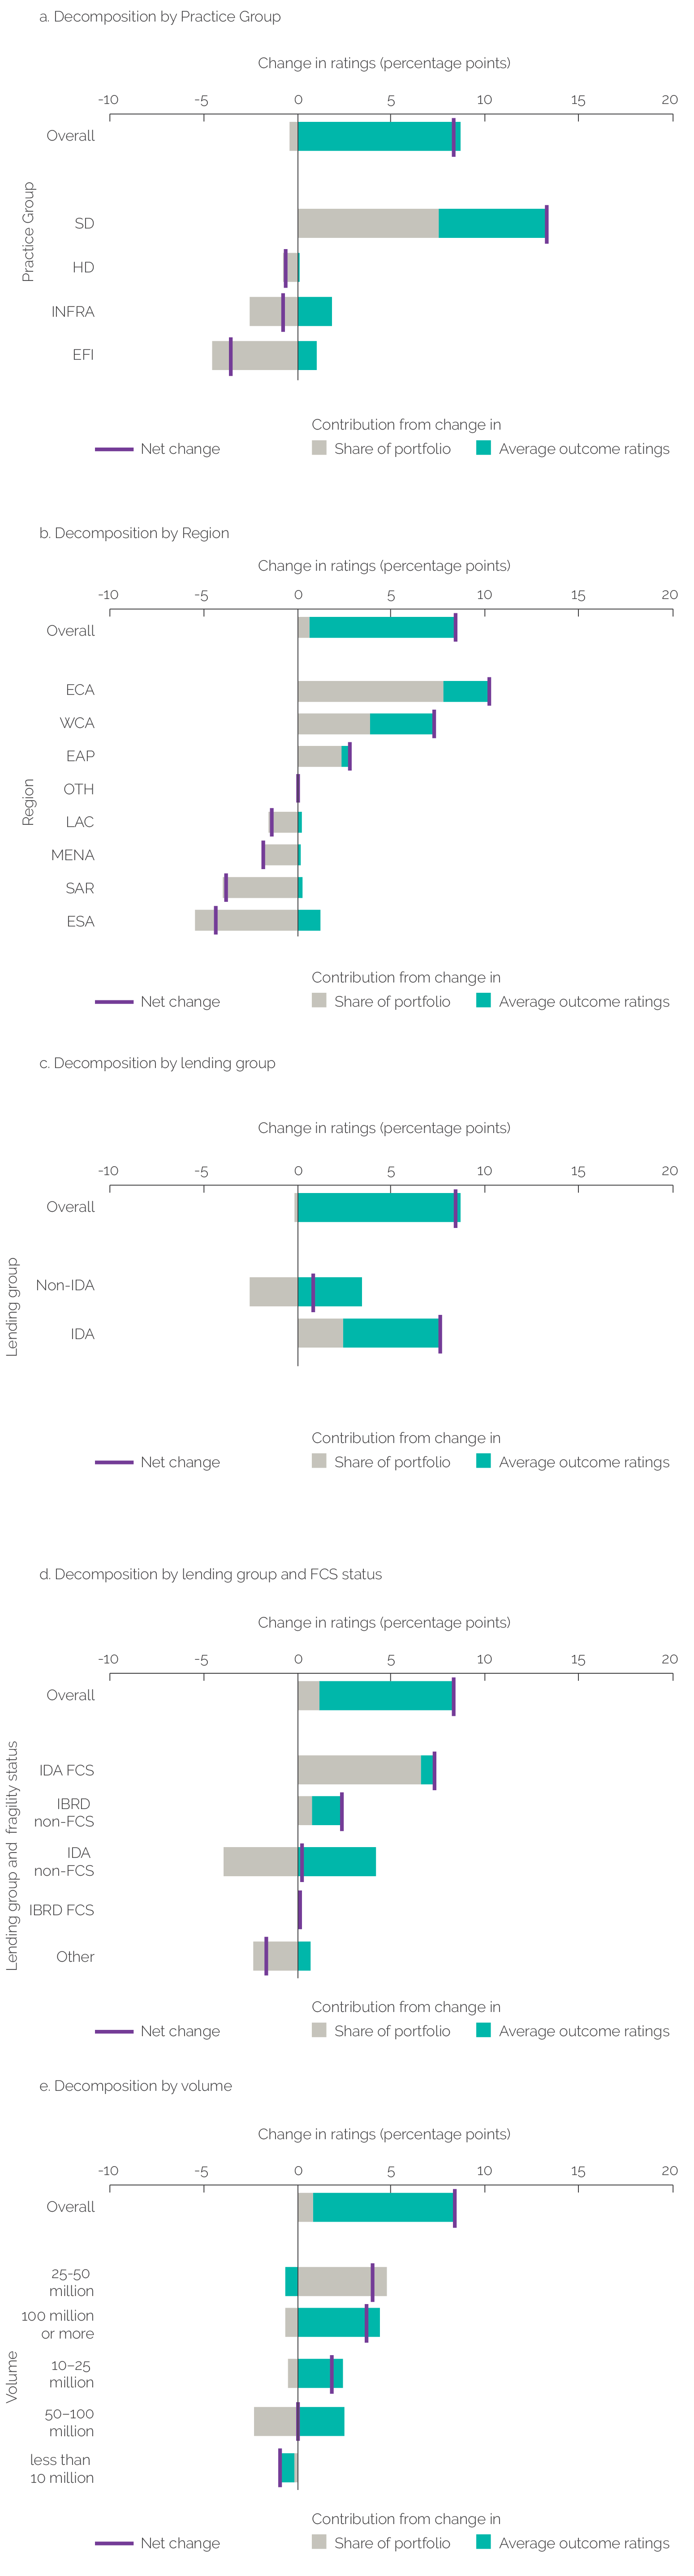
All World Bank Regions experienced a large rating increase, but this was especially the case for Europe and Central Asia and Western and Central Africa. In Europe and Central Asia, projects rated MS+ jumped from 81 to 94 percent (+13 percentage points); Europe and Central Asia is now the Region with the highest percentage of projects rated MS+. In West Africa, the ratings increase was even bigger, jumping from 69 to 85 percent of projects rated MS+ (+16 percentage points). Moreover, both Regions expanded their relative share of projects. The limited number of projects in any single year’s cohort, including FY20, prevented us from analyzing the ratings increase at the country level, but it is worth noting that the 34 projects in China, India, and Vietnam that closed in FY20 represent 18 percent of the World Bank’s entire portfolio (by number of projects), and all 34 of these projects were rated MS+.
Ratings improved in FCS and IDA countries. Between FY19 and FY20, the percentage of projects with outcome ratings of MS+ increased from 80 to 82 percent in FCS countries and from 75 to 86 percent in IDA lending projects (figure 2.3, panels c and d). This is notable because both categories have an expanding share of World Bank projects. Between FY19 and FY20, the share of projects in FCS countries increased from 15 to 23 percent of the overall portfolio, whereas the share of IDA lending increased from 47 to 51 percent. At the same time, the project outcome ratings for non-FCS projects increased more (from 79 to 89 percent of MS+) than the ratings for FCS projects, which reopened the ratings gap—which had narrowed in FY19—between FCS and non-FCS countries. The increase in the percentage of projects rated S+ was steep for all project categories, but even more so for FCS and IDA lending countries. IDA project outcome ratings in FCS countries increased from 78 to 81 percent of MS+, and the share of these projects increased from 14 to 22 percent in the overall portfolio. These ratings increases are encouraging considering the World Bank continues to expand its engagement in both FCS and IDA countries.
Project outcome ratings also increased notably for the largest World Bank projects (those over $100 million). Past studies associate a project’s size, by final project cost, with better ratings (Ralston 2014; World Bank 2016b).6 The positive relationship between project size and outcome ratings intensified in FY20, when the percentage of large projects rated MS+ surpassed 95 percent. At the same time, the outcome ratings for the smallest projects (below $10 million) decreased from 76 to 70 percent rated MS+.7
Disruptions from COVID-19 did not appear to explain the FY20 ratings jump. The RAP’s analysis dispels the concern that COVID-19’s process disruptions might have biased the FY20 cohort toward more successful projects (see box 2.1).8 Every year, projects with ICRs completed relatively quickly after the project closes tend to have higher ratings than projects whose ICRs are delayed, a pattern that the FY20 cohort displays nearly identically to previous cohorts.9 However, in FY20 the ratings were higher than in FY19 throughout the year, including before the pandemic. It is also worth noting that none of the projects that closed in FY20 were prepared in response to COVID-19. Moreover, it is possible that work disruptions under COVID-19 and the need to channel emergency COVID-19 responses through existing projects led to an increase in the number of project extensions (from closing in FY20 to closing in future years). These extended projects will be accounted for in the fiscal year in which they actually close; they will be visible in, and possibly larger in, future ratings cohorts—and may affect those ratings—but they did not affect the FY20 ratings.
Box 2.1. The Impact of the Coronavirus (COVID-19) Pandemic on Ratings
Potential Impact of Process Disruptions
Process disruptions related to the World Bank’s response to the coronavirus (COVID-19) pandemic do not appear to have driven the recent ratings jump. During the COVID-19 pandemic, Implementation Completion and Results Reports (ICRs) arrived at intervals similar to those of previous fiscal years. World Bank operational teams experienced significant changes in working conditions after the COVID-19 pandemic began, but these changes did not appear to affect the normal inflow of ICRs to the Independent Evaluation Group (IEG). In most fiscal years, IEG sees a characteristic pattern in the arrival of ICRs, with large peaks near the end of December and June (quarters 2 and 4), and smaller peaks near the end of September and March (quarters 1 and 3). Since March 2020, however, the monthly pattern of ICRs arriving to IEG remained similar to that of previous years. Overall, there was a decrease in the number of ICRs, a trend that has persisted for several years. The current set of projects validated by IEG in the fiscal year (FY)20 cohort is 194, with an additional 20 projects in IEG’s validation pipeline and another 26 projects for which ICRs had not yet been received as of the cutoff date for this Results and Performance of the World Bank Group. The FY20 coverage (91 percent out of 214, or 81 percent out of 240) is in line with previous years. Refer to appendix A for additional methodological details.
Ratings in FY20 are higher than ratings in FY19, irrespective of how quickly ICRs and ICR Reviews (ICRRs) were completed. This Results and Performance report’s analysis found that outcome ratings were negatively correlated with the length of time between the project’s close and IEG’s completion of the ICRR. This indicates that projects with higher ratings also completed their ICRs and ICRRs faster than projects with lower ratings. The analysis estimates a similar negative relationship for projects that closed in FY20 and projects that closed in previous years. However, the ratings for FY20 were higher than in FY19 throughout the self-evaluation and validation cycle compared with previous fiscal years.
Potential Impact of Change in Evaluator Rating Standards
There is no evidence that outcome measurement standards were more lenient during FY20. The disconnect between ICR ratings and the ICRR ratings during COVID-19 appears similar to the disconnect of previous years. The disconnect is the difference between the outcome rating the World Bank assigns in the ICR self-evaluation and the outcome rating IEG assigns in the ICRR validation. The Results and Performance report’s analysis of disconnect patterns shows fewer disconnects in FY20 (15 percent) than in FY19 (18 percent), but the difference is very small.
Ratings of ICR quality are roughly similar for recent and past ICRs. An internal IEG analysis of ICRRs completed recently indicates that ratings of ICR quality were similar to those reported in another IEG analysis from 2018. In both analyses, the outcome ratings assigned to projects with higher-quality ICRs (as measured by their ICR quality ratings) were less frequently downgraded (assigned a lower rating in the ICRR than in the ICR), and the pattern was similar in both periods.
Source: Independent Evaluation Group.
The slower-than-usual processing time of development policy financing (DPF) for the FY20 cohort was unlikely to have affected the ratings increase. The World Bank’s initiative to reform DPF ICRs, which began in 2017, led to a new DPF ICR template and a delay in processing both ICRs and ICRRs in FY20. Therefore, the number of FY20 DPFs whose ratings IEG validated is very small (only 9 of the 194 projects in the FY20 cohort). As a result, DPFs were unlikely to have contributed significantly to the overall increase in ratings, despite their strong ratings (all MS+). Moreover, there is no reason to expect that the validated ratings of processed DPFs will be significantly different from the ratings for DPFs that have not yet been validated.10
The FY20 increase in outcome ratings is notable because it occurred across almost all project categories. Ratings may increase because ratings for all project categories increase or because the share of already highly rated project categories in the overall portfolio increases. A decomposition analysis shows that the main contribution to the overall increase came not from portfolio changes but from ratings increases for virtually all categories of projects (figure 2.4).11 For example, the large increase in Sustainable Development ratings combined with the simultaneously large increase in the proportion of Sustainable Development projects in the overall portfolio accounted for a disproportionately large contribution from this Practice Group to the overall change in ratings. However, this contribution was partially offset by the shrinking portfolio shares of Infrastructure and Equitable Growth, Finance, and Institutions, since both of these Practice Groups also had positive ratings changes. Therefore, despite some portfolio changes, it was the positive and often large ratings increases across nearly all project categories that drove the ratings jump. See appendix A for more details on the decomposition analysis.
Figure 2.4. Select Contributors to the Increase in World Bank Project Outcome Ratings between Fiscal Years 2019 and 2020

Source: Independent Evaluation Group.
Note: Net change refers to the net change in the overall average outcome rating between FY19 and FY20 (weighted by the share of projects in each category); contribution from change in share of portfolio refers to the contribution to the net change from changes in the share of portfolio of each category of projects across the two periods (the “between” effect); contribution from change in average outcome rating refers to the contribution to the net change from changes in average outcome ratings in each category across the two periods (the “within” effect). EAP = East Asia and Pacific; ECA = Europe and Central Asia; EFI = Equitable Growth, Finance, and Institutions; ESA = Eastern and Southern Africa; FCS = fragile and conflict-affected situation; FY = fiscal year; HD = Human Development; IBRD = International Bank for Reconstruction and Development; IDA = International Development Association; INFRA = Infrastructure; LAC = Latin America and the Caribbean; MENA = Middle East and North Africa; OTH = other; SAR = South Asia; SD = Sustainable Development; WCA = Western and Central Africa.
Figure 2.4. Select Contributors to the Increase in World Bank Project Outcome Ratings between Fiscal Years 2019 and 2020
Source: Independent Evaluation Group.
Note: Net change refers to the net change in the overall average outcome rating between FY19 and FY20 (weighted by the share of projects in each category); contribution from change in share of portfolio refers to the contribution to the net change from changes in the share of portfolio of each category of projects across the two periods (the “between” effect); contribution from change in average outcome rating refers to the contribution to the net change from changes in average outcome ratings in each category across the two periods (the “within” effect). EAP = East Asia and Pacific; ECA = Europe and Central Asia; EFI = Equitable Growth, Finance, and Institutions; ESA = Eastern and Southern Africa; FCS = fragile and conflict-affected situation; FY = fiscal year; HD = Human Development; IBRD = International Bank for Reconstruction and Development; IDA = International Development Association; INFRA = Infrastructure; LAC = Latin America and the Caribbean; MENA = Middle East and North Africa; OTH = other; SAR = South Asia; SD = Sustainable Development; WCA = Western and Central Africa.
Bank performance ratings, which are positively correlated with the World Bank project outcome ratings, increased by 5 percentage points between FY19 and FY20, with 89 percent of projects rated MS+ in FY20. We cannot conclude that this increase drove the FY20 outcome ratings increase, but Bank performance ratings themselves are worth monitoring because they focus on elements within the World Bank’s control.12 Bank performance, defined in World Bank (2020b) as “the extent to which services provided by the World Bank ensured the operation’s quality at entry and supported effective implementation through appropriate supervision (including ensuring adequate transition arrangements for regular operation of supported activities after closing),” is composed of two elements that also have their own ratings—a project’s quality at entry and its quality of supervision.13, 14 Many project categories that experienced large increases in project outcome ratings also experienced increases in Bank performance ratings—this was the case for Sustainable Development, Europe and Central Asia, IDA non-FCS projects, and especially large projects. However, for other project categories, such as projects in Western and Central Africa, project outcome ratings increased despite decreasing Bank performance. That said, it is likely that Bank performance affects the achievement of project outcomes, but since both ratings are assigned at the same time, causality cannot be determined.
Within Bank performance ratings, quality at entry ratings increased substantially between FY19 and FY20, possibly contributing to the outcome ratings jump. Past studies by IEG and others indicate that quality at entry ratings are strongly associated with outcome ratings (Chauvet, Collier, and Duponchel 2010; Raimondo 2016; Smets, Knack, and Molenaers 2013; World Bank 2015, 2016b). Considering this, quality at entry has been on an upward trend since 2014 and further increased from 76 percent MS+ in FY19 to 81 percent in FY20.15 By contrast, the other half of Bank performance ratings—quality of supervision—has remained flat since FY18 after previous increases, albeit at a higher rate of 89 percent MS+. The RAP 2018 found that the most important enablers of quality at entry were strong client relationships; well-timed analytical work as a foundation for project design; team composition and experience; and adequate internal policies, guidance, and systems (World Bank 2019c). The presence of key World Bank staff in the country also improved quality at entry, whereas the absence of staff hindered it. The RAP 2018 identified challenges to quality at entry, including difficult operating environments (particularly in fragile situations), overly optimistic implementation schedules, weakly specified results frameworks, and projects not ready for implementation (for example, projects in which, at the time of approval, political economy issues were present, an implementation capacity assessment was not available, or questions related to a borrower’s commitment or mandate for project execution were unresolved).
M&E quality ratings improved substantially between FY19 and FY20 and could partially explain the ratings jump. M&E quality generally rates low, but it has improved since FY10, when only 25 percent of projects were rated substantial or high. The percentage of projects with M&E quality ratings of substantial or high increased from 51 (in FY19) to 59 percent (in FY20). Project categories for which outcome ratings increased the most also showed increases in M&E quality ratings. There were large increases in M&E quality ratings in Sustainable Development, Water, and large projects—all of which had significantly higher ratings in FY20. That said, there were a few notable exceptions to the positive correlation between the project outcome rating and the M&E quality rating. For example, M&E quality decreased in all FCS countries, including IDA FCS countries, and in projects in the $25–50 million range, despite those project categories also having improved outcome ratings. M&E quality ratings also decreased in Human Development and the South Asia Region. A deeper analysis of M&E ratings, discussed in the next section, shows that the robust increase in M&E quality has the strongest positive correlation with the increase in project-level efficacy ratings, which—along with relevance and efficiency ratings—determine project outcome ratings.
Other country- and project-specific factors that IEG has previously identified continue to influence project outcomes, but these factors do not explain the large FY20 increase. Previous IEG regression analyses reveal that a country’s capacity, a project’s duration, a project’s size, and the validation processing time all influence outcome ratings, and they continued to do so in FY20 (see World Bank 2018b, 2019c for a review of these factors). However, these factors’ influence on FY20 outcome ratings was very similar to their influence on previous years’ outcome ratings, so they do not explain the recent jump (appendix A, table A.1).16
Other potential factors may help explain the ratings increase, but we could not measure these factors. These factors include teams improving measurement frameworks, preparing better theories of change, and becoming comfortable with the newer ICR methodology, among others. These improvements could have resulted from ICR reforms in 2017 or internal training and informal knowledge exchanges, which led to an increased focus by operational teams and development effectiveness units on building robust theories of change and paying more systematic attention to M&E quality. It is possible these factors came to fruition in FY20 and contributed to the ratings increase, but we could not measure whether this was the case.
Longer-Term Ratings Improvements
The recent ratings increase continues a positive trend from previous years. This RAP’s analysis shows that longer-term ratings increases can occur with improved M&E and selective risk taking derived from adding new activities in successor projects. That said, this section also shows that the World Bank sometimes selects and approves indicators and targets that do not robustly measure development results.
Project outcome ratings have been increasing over the past seven to eight years. A three-year rolling average shows that starting from FY13, ratings have steadily increased, both for average outcome ratings and as a percentage of projects with outcomes rated MS+. The percentage of projects rated S+ has also been markedly increasing (figure 2.5).
Figure 2.5. World Bank Project Outcome Ratings, Three-Year Rolling Average, by Number of Projects

Source: Independent Evaluation Group.
Note: MS+ = moderately satisfactory or above; S+ = satisfactory or above.
Figure 2.5. World Bank Project Outcome Ratings, Three-Year Rolling Average, by Number of Projects

Source: Independent Evaluation Group.
Note: MS+ = moderately satisfactory or above; S+ = satisfactory or above.
Ratings and Project Novelty
The longer-term upward trend in ratings does not appear to be due to less risk being taken. We looked at aversion to risk in terms of the tendency to repeat project designs in successive projects versus the willingness to expand or introduce new elements in successor project designs. We focused on two Global Practices—Education and Transport—with larger portfolios and large shares of highly rated projects (see a methodological summary in box 2.2). Contrary to expectations, successor projects that introduced novelty, or new elements, performed as well as or better than projects that closely replicated their predecessors. This indicates that the World Bank has been able to take informed risk and selectively introduce new elements relevant to context without suffering lower project outcome ratings. That being said, the analysis did not directly look at projects’ contextual elements or task teams’ risk-mitigation measures; moreover, the evidence from this analysis is from only two sectors and not entirely representative of how World Bank projects, as a whole, build on and learn from past projects.
Box 2.2. Methodology of the Novelty Analysis
We carried out a detailed analysis of how consecutive Transport and Education projects changed in individual countries. We selected a sample of projects that closed in fiscal year (FY)12–14 (early period) and FY17–20 (later period).a The sample was representative of the Transport and Education Global Practices’ project portfolios that closed in each period, with a 90 percent confidence level and a 10 percent margin of error. The team matched each sampled project to a predecessor project, defined—for the purposes of this exercise—as a project in the same Global Practice and the same country that closed five years or less before the sampled successor project started; covered at least one common subsector; and had the same implementation agency as the predecessor project. In total, the sample included 75 Transport projects (of which 49 had a predecessor) and 79 Education projects (of which 55 had a predecessor). We analyzed these projects’ activities using Implementation Completion and Results Reports, Project Appraisal Documents, and Implementation Completion and Results Report Reviews as sources of information.
We compared predecessor and successor projects by looking at the projects’ Independent Evaluation Group ratings, the number of new activities, and their level of difficulty as determined by Independent Evaluation Group sector experts.b We rated the novelty of each successor project as limited, moderate, or high, according to the following criteria:
- Successor projects of limited novelty had up to two new activities that the predecessor project did not have, at least one of which was assessed to be of limited difficulty, and the project’s scope remained roughly the same or was scaled down.
- Successor projects of moderate novelty had between two and four new activities that the predecessor project did not have, at least half of which were assessed to be of moderate difficulty, or had more than four new activities that were assessed to be of limited or moderate difficulty.
- Successor projects of high novelty had more than four new activities that the predecessor project did not have, at least two of which were assessed to be of high difficulty.
The team also examined first-time projects, which did not have predecessors. This group of projects included 26 first-time projects for Transport and 24 first-time projects for Education. Appendix A provides more details on this analysis.
Source: Independent Evaluation Group.
Note: a. The samples for the two periods were pooled because no differences in rating patterns were detected across the periods. b. In Education, some activities with limited difficulty included school construction, teacher training, or textbook policies and distribution. Activities of moderate difficulty included curriculum reviews, performance-based agreements and revision of work programs, or teacher certification systems. Activities of high difficulty included sector reforms, governance systems, or legal frameworks. In Transport, activities of limited difficulty included infrastructure rehabilitation and maintenance, feasibility studies, or staff training. Moderately difficult activities included highway, railway, or airport construction; the introduction of performance-based contracts; or the revision of public-private partnership frameworks. Highly difficult activities included establishing sector agencies, setting up a road fund, or designing and implementing sector reforms.
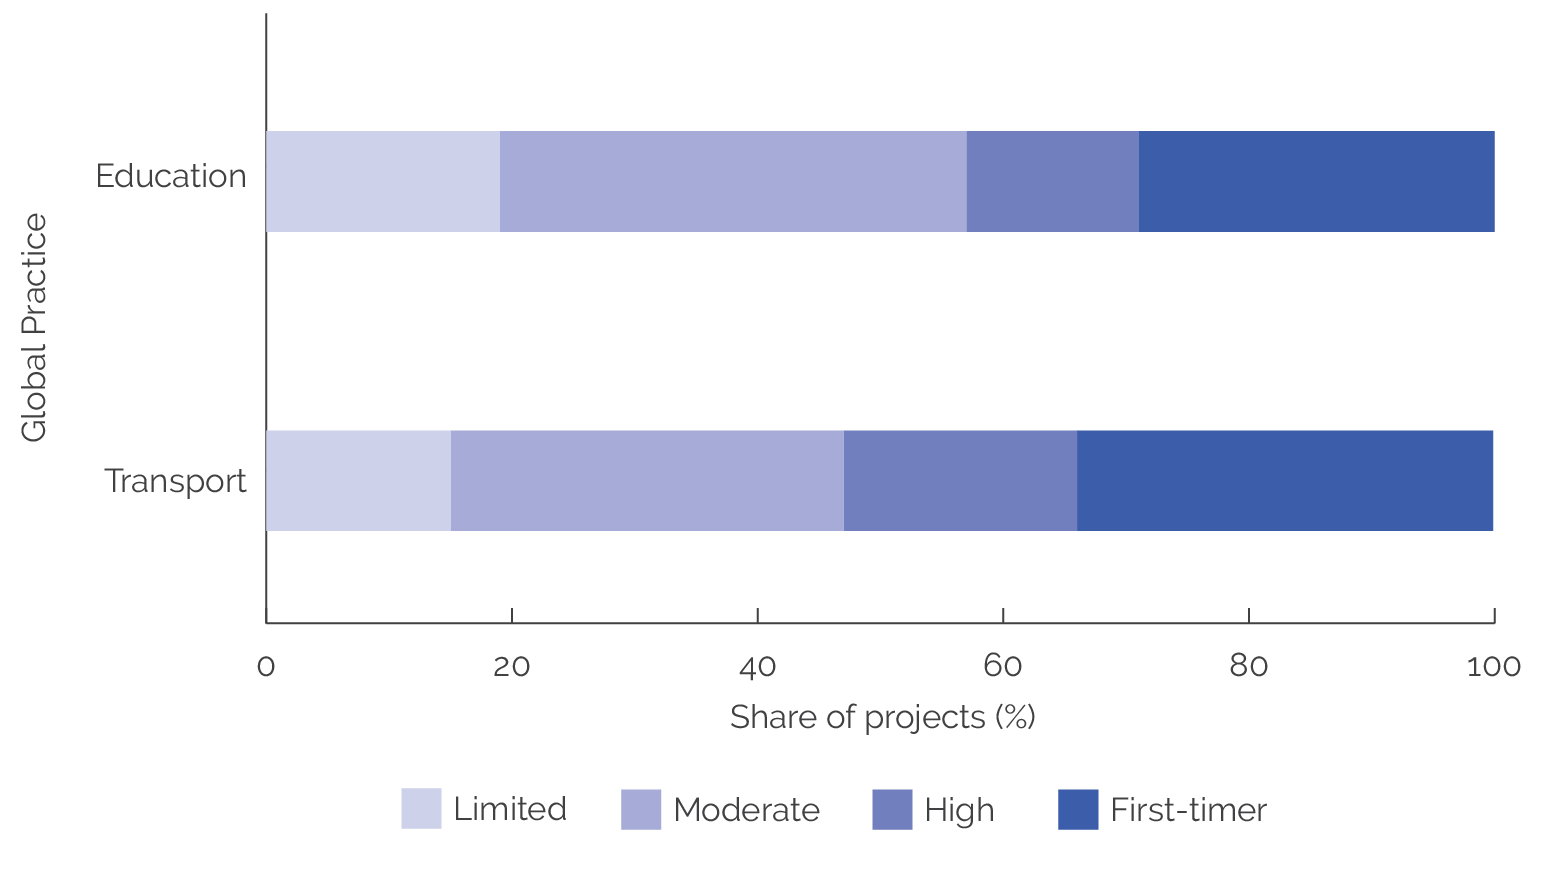
The World Bank tends to build on previous projects rather than introduce entirely new projects, in both the Transport and Education Global Practices (GPs). Approximately one-third of projects in both GPs were first-time projects that did not have a predecessor project (29 percent in Education and 35 percent in Transport), whereas the remaining two-thirds of projects were linked to predecessor projects (figure 2.6).
Most successor projects introduced new elements that were not included in their predecessor projects; few projects repeated the predecessor’s project design. Approximately half of the sampled successor projects in both GPs were moderately novel, whereas 20 percent of Education successor projects and 29 percent of Transport successor projects were highly novel. This shows that Education projects tend to introduce fewer novel elements than Transport projects, but overall the pattern of novelty is similar in both GPs. Likewise, only approximately one-quarter of successor projects in both GPs have limited novelty, or largely repeat project elements from their predecessor projects (figure 2.6).
Figure 2.6. Distribution of Education and Transport Projects, by Novelty Level

Source: Independent Evaluation Group.
Figure 2.6. Distribution of Education and Transport Projects, by Novelty Level
Source: Independent Evaluation Group.
The new elements in project designs consisted of more complex and challenging activities or a broader geographic or thematic scope than the predecessor project. In an example of greater complexity, the Ghana Education For All Fast Track Initiative (P116441) provided learning materials, salary incentives, and teacher training to attract teachers to deprived districts. The follow-on Ghana Partnership for Education project (P129381) carried out similar activities but added elements of institutional strengthening (such as annual work programs with district education offices and school improvement grants), which increased the project’s level of difficulty because the success of these elements often depends on external factors and has long time horizons. In an example of greater geographic scope, the predecessor Buenos Aires Urban Transport Project (P039584) financed public transport interventions and technical assistance in the Buenos Aires metropolitan area. The successor Argentina Urban Transport in Metropolitan Areas project (P095485) then extended the project’s scope to medium-size cities in Argentina. In an example of greater thematic scope, the Road Sector Development Project (P050623) in Ghana was essentially an interurban road rehabilitation and improvement project. Meanwhile, the follow-on Transport Sector Project (P102000) ventured into new subsectors, such as air, urban, and waterborne transport, and had several additional goals in new thematic areas, including improved sector planning, upgraded urban roads and urban transport infrastructure, and strengthened institutional capacity for transport agencies.
The projects that introduced new elements, or novelty in project design, achieved higher increases in ratings than projects that simply repeated their predecessors. In Education, 82 percent of successor projects that introduced high novelty performed better than or the same as their predecessors, whereas only 64 percent of projects that introduced limited novelty performed better or the same. Something very similar happened in Transport (figure 2.7). Among projects that introduced greater novelty, most of their predecessors were rated MS+. In fact, there was only one example from each GP where a task team added a high level of novelty to a project that followed a project rated unsatisfactory. There is no evidence that task teams use novelty to course correct unsatisfactory projects. Rather, task teams phase novelty into projects that already perform well and can more easily sustain expanded, or more difficult, activities while maintaining or even increasing ratings. This suggests that World Bank task teams introduce novelty to more promising projects, hence taking risks when conditions indicate a higher likelihood of success.
First-time projects were simpler—that is, had fewer elements—than successor projects in the Education and Transport GPs. In Education, first-time projects, on average, covered fewer subsectors, had fewer safeguard implications, and had fewer commitments compared with successor projects.17 In Transport, first-time projects had fewer project sites, subsectors, and commitments, but had more safeguard implications. By designing low-complexity first-time projects, task teams decrease the risk and uncertainty of those projects.
Figure 2.7. Changes in World Bank Project Outcome Ratings from Predecessor to Successor Projects, by Global Practice and Novelty Level

Source: Independent Evaluation Group.
Note: Red indicates successor projects with lower ratings than their predecessor project; yellow, successor projects with the same ratings as their predecessor project; and teal, successor projects with higher ratings than their predecessor project.
Ratings and Types of Outcomes
A project’s M&E quality plays a larger role in explaining ratings than the type of outcomes a project aims to achieve. We analyzed whether ratings vary when project outcomes, defined as the intended changes pursued by a specific project objective, vary (box 2.3).18 Our analysis indicates that there is a weak relationship between a project’s outcome types and its objective-level efficacy ratings (see appendix B for details on the methodology and the outcome type analysis). Only 4 outcome types out of the 16 identified—expanded access to services, increased human capital, improved enterprise and sector performance, and enhanced equity and inclusion—were associated with higher objective-level efficacy ratings than the remaining outcome types. However, this was largely due to the fact that the projects pursuing these outcomes had stronger M&E. That is, the M&E quality of a project plays a bigger role in explaining ratings than do outcome types. To some extent, this is likely due to the rating methodology: The project’s achievement is assessed against the project’s specific targets and objectives rather than against standardized objectives and targets associated with standardized outcome types.
Box 2.3. Methodology of Outcome Type Analysis
Outcome types capture the type of change envisioned by project objectives. We defined an outcome typology, which includes 16 outcome types, derived from typical project theories of change and select corporate objectives. Examples of outcome types include expanded access to services, enhanced institutional capacity, improved service quality, increased human capital, and 12 others. We analyzed outcome types for a representative sample of World Bank projects for two different time periods: projects that closed in fiscal year (FY)14–16 and projects that closed between FY17 and the second quarter of FY20. The two samples were representative at the Practice Group level with a 90 percent confidence level and a 10 percent margin of error. We used each individual project objective identified during validation as the unit of analysis. This allowed the team to analyze variations in objective-level efficacy ratings as outcome types vary. Appendixes A and B contain additional details.
Source: Independent Evaluation Group.
Ratings and Monitoring and Evaluation
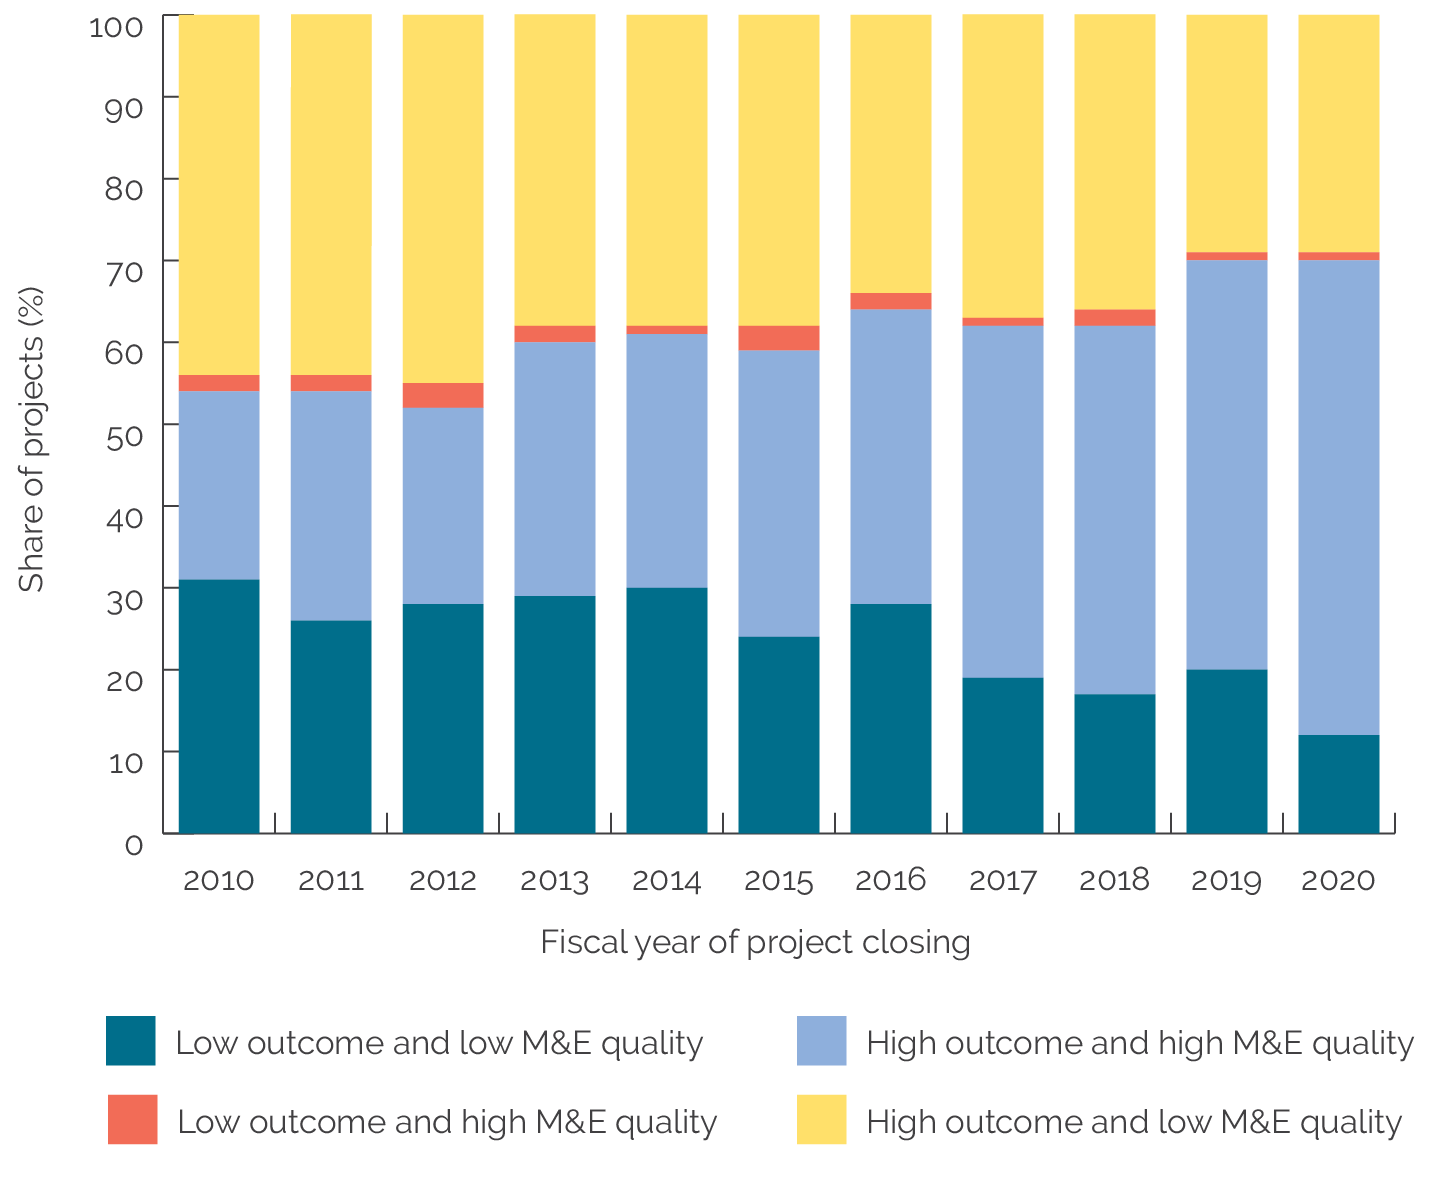
Better M&E helps explain higher project outcome ratings. The percentage of projects with M&E quality rated substantial or high has increased considerably, from 25 percent in FY10 to 59 percent in FY20. The largest increases have occurred since FY16, when project outcome ratings also increased the most. Also, the share of coherently rated projects—that is, those with high M&E quality ratings and high project outcome ratings, or low M&E quality ratings and low project outcome ratings—has also increased since 2010 (figure 2.8). The percentage of coherently rated projects increased from 54 percent in 2010 to 70 percent in both FY19 and FY20. Although there is no proof of causation, studies have suggested that M&E quality may have a genuine impact on project outcome ratings. For example, Raimondo (2016) calculates that projects with high M&E quality ratings perform between 0.13 and 0.40 points better (in terms of average project outcome ratings) than projects with low M&E quality. One potential explanation is that better M&E systems allow better adaptive management, which is necessary to ensuring project success.
Figure 2.8. World Bank Project Outcome Ratings and Monitoring and Evaluation Quality

Source: Independent Evaluation Group.
Note: “High” M&E quality corresponds to substantial or high ratings. “Low” M&E quality corresponds to modest or negligible ratings. M&E = monitoring and evaluation.
Figure 2.8. World Bank Project Outcome Ratings and Monitoring and Evaluation Quality
Source: Independent Evaluation Group.
Note: “High” M&E quality corresponds to substantial or high ratings. “Low” M&E quality corresponds to modest or negligible ratings. M&E = monitoring and evaluation.
Ratings and Project Indicators and Targets
High project outcome ratings do not necessarily mean that projects have higher quality indicators or more ambitious targets. First, in FY20, 29 percent of projects with outcomes rated MS+ had only modest or negligible M&E quality ratings (figure 2.8). Second, an in-depth analysis of the type and quality of indicators and targets showed that even when indicators and targets are not fully adequate for measuring results, projects can still achieve good ratings (see box 2.4). This latter finding in particular suggests that project teams and operational management do not systematically scrutinize the selection of project indicators and targets, which as a result differ widely in their adequacy to measure project achievements directly and objectively. At the same time, projects that meet their defined targets are likely to achieve higher ratings regardless of what those targets represent.
Box 2.4. Methodology of the Indicator and Target Analyses
To explore the relationship between outcome ratings and monitoring and evaluation, we analyzed the type and quality of indicators in projects with institutional strengthening objectives and all the targets of project development objective indicators of a sample of projects with only high, or only low, objective-level efficacy ratings.
Indicator analysis. The Results and Performance of the World Bank Group team analyzed the project objectives characterized as having “institutional strengthening” outcome types (appendix B) using projects sampled for the novelty and outcome type analysis (appendix A). We selected projects with institutional strengthening objectives because this is one of the most prevalent outcome types, is present in all sectors, and is critical for achieving development results (including the sustainability of development results). The analysis included objectives that were solely institutional strengthening and objectives that were institutional strengthening along with other outcome types. We analyzed 707 objectives in 268 projects. We identified, classified, and linked the institutional strengthening indicators to their corresponding objective-level efficacy ratings based on information from Implementation Completion and Results Report (ICR) Reviews.
Target analysis. We analyzed the achievement of project development objective indicator targets using projects sampled for the novelty and outcome type analysis (appendix A). Among those projects, we selected projects in both extremes of the objective-level efficacy distribution—that is, projects in which either (i) all the objective-level efficacy ratings were negligible or modest (76 projects), or (ii) either the objective-level efficacy ratings were all high, or some were high and others substantial (39 projects). The 115 projects encompassed 647 project development objective indicators and targets. Next, we excluded indicators whose targets were revised, so we could maintain an unambiguous connection with objective-level efficacy ratings. This resulted in a sample of 340 indicators across 79 projects. We classified each target as exceeded, fully achieved, partially achieved, not achieved, or no evidence provided. The unit of analysis was the indicator (along with its associated target). We used ICR annexes instead of ICR Reviews as the primary source of information because ICR annexes, unlike ICR Reviews, list project development objective indicators and targets systematically. Selecting projects with all individual objectives rated negligible or modest or all rated high (or some high and some substantial) helped to unequivocally associate each efficacy rating with a single achievement category (exceeded, fully achieved, and so on), but this implies that the analysis is not generalizable to all projects.
Appendix A provides more details on both analyses.
Source: Independent Evaluation Group.
Not all individual project objectives have indicators to measure them, and many rely on weak evidence. We analyzed in-depth projects with institutional strengthening–related objectives and found that 7 percent had no defined indicators to measure them.19 Moreover, 53 percent have indicators that measure only outputs or rely on anecdotal evidence (table 2.1). Output indicators measure whether teams completed actions toward achieving an outcome rather than whether the outcome has been achieved. Efficacy ratings based on output indicators can therefore be rated substantial or high even when the project did not achieve its institutional strengthening outcome. Something similar happens when projects measure objectives with anecdotal evidence, which is considered a weak form of evidence when it relies on personal observations collected in a nonsystematic manner. For example, projects used the opinion of individual stakeholders, who were not purposefully selected, to determine whether a project achieved its institutional strengthening objectives rather than using a more systematic, independent, or objective measurement.20 These findings suggest room for improvement in ensuring adequate attention to results measurement and to the quality and appropriateness of indicators (table 2.1).
Moreover, projects often measure institutional strengthening objectives only indirectly. For 28 percent of institutional strengthening–related objectives, the project did not directly measure institutional strengthening (table 2.1). Rather, these projects measured the potential consequences of having stronger institutions, in terms of, for example, reduced travel times, reduced emissions, decreased rates of maternal deaths, improved health behaviors, improved education participation, and so on. It is possible that institutional strengthening activities did contribute to these outcomes, but this contribution was not measured. This is an example of low construct validity (that is, indicators poorly measuring what they are supposed to measure). In such cases, it would be possible for institutional strengthening objectives to receive high efficacy ratings without achieving the actual outcome, or conversely for projects that achieve their institutional strengthening objectives not to receive high ratings.
Table 2.1. Quality of Indicators Measuring Institutional Strengthening Objectives
|
Approach to Indicators |
Share of Objectives Pursuing Institutional Strengthening (%) |
Average Objective Efficacy Ratings |
|
No indicator defined |
7 |
2.0 |
|
Weak indicator definition (outputs or anecdotal evidence) |
53 |
2.6 |
|
Indicator defined in terms of indirect measurement only |
28 |
2.8 |
|
Indicator defined in terms of relatively more direct or “plausible” measures of institutional strengthening |
30 |
2.7 |
Source: Independent Evaluation Group.
Note: The analysis is based on 707 objectives in 268 projects. The categories above are not mutually exclusive. The average efficacy ratings have been calculated based on the following scale: high = 4, substantial = 3, modest = 2, negligible = 1.
That said, many projects adequately measure institutional strengthening objectives. Approximately one-third of objectives used a more direct or “plausible” measurement approach (table 2.1). In projects with institutional strengthening objectives, a direct approach measures the performance of the institutions that the project strengthened. For example, direct indicators included increased ministry revenues or expenditures; decreased time for the institution to process licenses or disseminate annual statistics; increased on-time court case settlements; more project approvals by the relevant ministry; more reports published; and fewer inclusion errors from an agency’s targeting mechanisms. Meanwhile, a plausible approach measures results that were plausibly attributable to institutional strengthening activities. In some cases, this approach measures demand-side factors, such as beneficiary satisfaction with an institution or training program, or supply-side factors by assessing a ministry’s capacity or training participants’ skill levels. Box 2.5 provides examples of robust indicators that projects have used to measure institutional strengthening.
Box 2.5. Examples of Project Objectives with Robust Measurement of Institutional Strengthening
Second Eastern Indonesia Region Transport Project (P074290)
Objective: Decentralize the planning and management responsibilities for public works on Indonesia’s provincial and kabupaten (regency) roads from the central to the provincial and kabupaten governments.
Measurement: The project measured this objective with supplemental performance evaluation data on timeliness, documentation, and successful completion of the intended civil works programs in each territory. The task team created an index of performance in which a score of 70 percent was the threshold for acceptable performance.
Punjab Municipal Services Improvement Project (P083929)
Objective: Improve the delivery and effectiveness of urban services in Punjab’s participating municipalities in Pakistan.
Measurement: The project measured this objective using two institutional development assessments by the Punjab Municipal Development Fund Company (one of the two implementing agencies), with assistance from the World Bank’s supervision team. The first assessment was completed just before the Mid-Term Review in January 2010, and the second was completed in early 2013, approximately six months before closure.
Maputo Municipal Development Program II (P115217)
Objective: Improve the sustainability of municipal services in Mozambique’s Maputo Municipality.
Measurement: The project measured this objective using citizen report cards that recorded residents’ overall perceptions of city services. The mean scores were reported to assess changes in resident perceptions of services.
Source: Independent Evaluation Group.
Objectives that lacked indicators had lower efficacy ratings, but projects with higher quality indicators did not always have higher efficacy ratings. Objectives with no indicators (no evidence) to measure institutional strengthening had an average efficacy rating of 2, measured on a scale from 1 to 4. Objectives that measured institutional strengthening more directly had an average efficacy rating of 2.7, whereas objectives that measured institutional strengthening indirectly or through weak evidence had ratings of 2.8 and 2.6 (table 2.1). That is, projects with more rigorous indicators do not have higher efficacy ratings than projects with less rigorous indicators.21
When projects use weak evidence to measure project objectives and still obtain relatively high ratings, one questions the reliability of efficacy ratings. The use of output indicators or unreliably collected anecdotal evidence to measure outcomes leads to validity issues and possibly to artificially high (or low) efficacy ratings. This is because weak evidence creates an arbitrary space for deciding whether or not projects achieved results.
Meeting targets is strongly associated, by design, with higher efficacy ratings. Among projects with highly rated objectives, the majority of targets were achieved or surpassed (table 2.2). Efficacy ratings decrease as the percentage of targets that a project achieves diminishes. That said, a notable share of projects with low (modest or negligible) efficacy ratings also achieved or surpassed their targets (table 2.2). This can happen in several scenarios: (i) When the project team writes the ICR, or when IEG completes the ICRR, they determine that one or more indicators underlying the targets were actually not adequate to measure objectives (for example, when project development objective indicators measure only activities, outputs, or beneficiaries rather than measuring the intended outcomes defined in the project development objective); (ii) there is evidence that the targets were intentionally overly conservative; or (iii) IEG’s ICRR finds less or weaker evidence of achievement than the ICR does for the same indicator and targets (a circumstance that may be more likely when qualitative indicators are used).22
The RAP’s closer analysis of targets uncovered a number of shortcomings. First, a relatively high percentage of (quantitative) targets that were achieved were exactly achieved, an implausible result that calls into question the reliability of reported data. Twenty-seven percent of the original targets and 33 percent of the revised targets classified as “fully achieved” achieved their quantitative target exactly. Second, many targets are set in absolute terms, providing a measure of the project’s size or reach, rather than in relative (percentage) terms, providing a measure of how well the project fills gaps or meets development needs. Third, many project development objective indicator targets had a zero baseline, often meaning that these indicators only measure outputs or lack data to build a baseline.23
Table 2.2. Indicators in Each Achievement Category of Project Development Objective Targets for Three Project Groupings (percent)
|
Achievement of Indicator Targets |
Grouping of Projects |
||
|
All Objectives Had High Efficacy Ratings |
Objectives Had a Mix of High and Substantial Efficacy Ratings |
All Objectives Had Negligible or Modest Efficacy Ratings |
|
|
Exceeded |
54 |
42 |
26 |
|
Fully achieved |
43 |
28 |
21 |
|
Partially achieved |
3 |
15 |
21 |
|
Not achieved |
0 |
6 |
18 |
|
No evidence |
0 |
3 |
10 |
|
Other |
0 |
6 |
4 |
|
Total |
100 |
100 |
100 |
|
Number of indicators |
(N = 35) |
(N = 67) |
(N = 238) |
Source: Independent Evaluation Group.
Note: The analysis is based on projects in the two extremes of the objective-level efficacy ratings distribution selected from those sampled for the outcome type analysis; that is, it takes a representative sample of projects that closed in fiscal year (FY)12–14 and from FY17 to the second quarter of FY20 (see appendix A). From that sample, this analysis excludes indicators whose targets were revised to maintain an unambiguous connection between indicators-plus-targets and objective-level efficacy ratings. The resulting analysis set included 340 indicators. “Other” includes indicators that have no baselines or no targets, or were dropped.
Neither IEG nor World Bank management often scrutinize the appropriateness of project targets. This is surprising considering how fundamental achieving targets is to high efficacy ratings. IEG’s objective-based methodology does not require IEG reviewers to scrutinize the quality of targets; therefore, ICRs rarely discuss or justify how targets are set or revised. And yet, if ratings strongly depend on targets being achieved, a legitimate question is whether these targets represent a sufficient improvement over baselines and are not too conservative. A better process for target setting that is more transparent could help IEG and the World Bank better assess projects’ actual achievements.
- The Results and Performance of the World Bank Group (RAP) reports measure performance through ratings assigned during the Implementation Completion and Results Report Review (ICRR) validation of the Implementation Completion and Results Report (ICR) project self-evaluation.
- Ratings for World Bank projects in this report are aggregated according to the closing fiscal year of the project, so fiscal year (FY)20 here refers to the group of World Bank projects that closed in FY20, completed their ICRs, and had their ICRs validated by the Independent Evaluation Group (IEG) in ICRRs by August 10, 2021.
- The more detailed definition of the FY17 cohort was projects closed in FY17, FY18, FY19, or the first two quarters of FY20 and that had ICRRs completed with ratings available in the system as of January 21, 2021. For additional information, see appendix A.
- For the self-evaluation reports of International Finance Corporation (IFC) investment projects (Expanded Project Supervision Report) and advisory projects (Project Completion Report) as well as Multilateral Investment Guarantee Agency projects (Project Evaluation Report), the trend data reported in this RAP includes those self-evaluation reports validated by IEG by August 10, 2021.
- In the backfilling exercise, the IFC retroactively applied the Anticipated Impact Measurement and Monitoring (AIMM) framework to projects whose approval predated the AIMM framework, including identification of outcome claims, conducting underlying analysis of development outcomes, indicator targets and results, and assignment of corresponding ratings (collectively we call these AIMM data in this RAP). This exercise identified outcome claims and their expected results and verified the results for each outcome claim. The IFC projects to which AIMM was applied at approval have not yet been evaluated by IEG.
- Ratings for World Bank projects are aggregated according to the closing fiscal year of the project. Ratings become available after three milestones occur: (i) the project closes; (ii) the project team completes theImplementation Completion and Results Report (ICR; usually within 6 months of project closing) and the Regional Director approves it, which results in the ICR arriving at the Independent Evaluation Group (IEG) for validation; and (iii) IEG completes the ICR Review (ICRR), thereby validating the ICR and producing final ratings. The cutoff date for trend data reported in this Results and Performance of the World Bank Group (RAP) is August 10, 2021. Thus, “FY20 projects” indicates World Bank projects that closed in fiscal year (FY)20, and completed their ICR and had their ICR validated by IEG in an ICRR by August 10, 2021. A total of 194 projects met this requirement and were therefore accounted for; by August 10, 2021, another 20 had not been validated yet and 26 had not completed an ICR. The number analyzed therefore represents 91 percent of all projects (or 194/214, if only those projects waiting for an ICRR are considered) or 81 percent (or 194/240, if projects missing an ICR are also included in the denominator). These are very high percentages compared to previous years.
- For a review of factors associated with World Bank project performance, see World Bank 2018b.
- There was an increase in project outcomes rated moderately satisfactory or above from 71 to 80 percent from FY16 to FY17, which was driven by a decrease in the percentage of projects with unsatisfactory ratings.
- This follows, however, a steep drop from FY18 to FY19.
- Water (+16.8 percentage points increase in projects with outcome rated moderately satisfactory or above) and Urban, Disaster Risk Management, Resilience, and Land (+20.5 percentage points) were the two Global Practices (GPs) within Sustainable Development that had the largest increase in ratings. Both GPs also increased their relative portfolio shares. However, it should be stressed that the number of projects within each GP for individual FYs is not large enough to meaningfully analyze ratings at the GP level, especially for the smaller GPs.
- Ralston (2014) found that large projects tended to have higher outcome ratings. IEG’s RAP 2015, which analyzed projects based on the project’s initial size compared with its final size, found that the change in project size is significantly correlated with project outcome ratings (World Bank 2016b).
- IEG’s RAP 2017 (World Bank 2018b) found that the distribution of World Bank financing volumes across projects is uneven, with a few very large projects accounting for a large share of this volume. Among projects that closed during FY11–16, very large projects ($500 million or above) accounted for 4 percent of projects and 35 percent of volume, and projects under $100 million accounted for 74 percent of projects and 21 percent of volume. Projects between $100 million and $500 million accounted for 22 percent of projects and 44 percent of volume.
- For details on the number of projects still unaccounted for in the FY20 cohort, see endnote 1.
- This dispels the hypothesis that the increase in FY20 ratings was due to a disproportionate share of highly rated projects completing their ICR and ICRR cycle quicker than in previous years because of work disruptions from the coronavirus pandemic.
- Development policy financing had historically similar or higher ratings than investment policy financing, except in FY17 and FY18, when the percentage of development policy financing rated MS+ was noticeably lower than for investment policy financing. In any case, the small amount of development policy financing in FY20 cannot impact the overall project outcome ratings meaningfully.
- The figure presents the results of a decomposition of the increase in project outcome ratings between FY19 and FY20, separately calculated for each category of projects. There is an online dashboard for this year’s RAP that includes more project categories and shows results for other types of ratings besides project outcome ratings, such as monitoring and evaluation quality, World Bank quality at entry, and World Bank quality of supervision. Appendix A shows the formula to decompose the ratings. Because of a small N value, decomposition analysis is not meaningful at the GP level.
- Ultimately, outcome ratings are informed by project achievements that depend not only on the World Bank’s efforts but also on external factors such as borrower performance, a country’s economy, the government’s political commitment to reform, and the general context and enabling environment.
- Quality at entry refers to how well the World Bank identified, prepared, and appraised a project so that it was most likely to achieve the project’s planned development outcomes and was consistent with the World Bank’s fiduciary role. Criteria for the rating of quality at entry include the following: the project’s strategic relevance and approach; technical, financial, and economic aspects (for investment project financing); poverty, gender, and social development aspects; environmental aspects (including provisions for safeguard policy compliance); fiduciary aspects; policy and institutional aspects; implementation arrangements; monitoring and evaluation arrangements; risk assessments; and World Bank inputs and processes.
- Quality of supervision refers to the extent to which the World Bank proactively identified and resolved threats to the achievement of relevant development outcomes. Criteria for the rating of quality of supervision include focus (of project implementation) on development impact; supervision of fiduciary and safeguard or environmental and social aspects (when applicable); adequacy of supervision inputs and processes (including missions, as well as location and availability of key staff); candor and quality of performance reporting; and the World Bank’s role in ensuring adequate transition arrangements (for regular operation of supported activities after loan/credit closing).
- Quality at entry ratings are assigned at project closing, not at project appraisal.
- A regression of average project outcome ratings on project development objective restructuring, country capacity measured by the Human Capital Index, lending volume, and days between project closing and ICRR completion showed that the coefficient of the dummy variable for projects that closed in FY20 remained large and significant. The RAP applied several different specifications, but—although the regressors cited above were all statistically significant in explaining average outcome ratings—the positive effect for FY20 remained largely unexplained and was not absorbed by a differential impact of the regressors for FY20.
- First-time projects and successor projects with limited novelty are more frequently used in fragile and conflict-affected situation countries.
- The hypothesis is that outcome ratings may be explained by the type of development outcomes that the project aims to achieve and, specifically, that some outcome types may be inherently more or less likely to be achieved. Outcome types offer a new way to classify projects and represent characteristics that are comparable across projects of different Practice Groups, GPs, and Regions.
- This may be due to the fact that these objectives also pursue another outcome type, which would be the one with one or more associated indicators. In any case, it is still hard to justify that objectives with clear institutional strengthening outcomes do not have any indicator to measure that outcome.
- This category of weak evidence included projects where the ICRR outcome sections collated narratives from various sections of the ICR or reported observations from interviews with project task team leaders.
- A factor to consider is that projects often include multiple indicators to measure individual objectives, and the ICRR evaluator (who assigns the objective-level efficacy rating) is left to decide how to weigh the various pieces of evidence, based only on what is presented in the ICR, when assigning ratings.
- The objective-level efficacy rating is assigned by the ICRR, not the ICR. Therefore, if the indicator table in the ICR lists a target as exceeded, and the ICRR evaluator finds that evidence provided indicates the target was not in fact exceeded, the rating in the ICRR may be lower than the rating implied by the ICR narrative.
- Many indicators had a zero baseline. Out of 428 indicators in projects with negligible project efficacy ratings, 226 (53 percent) had a zero baseline; out of 217 indicators in projects with high or substantial project efficacy ratings, 87 (40 percent) had a zero baseline. For example, about 10 percent of project development objective indicators measured the number of direct project beneficiaries. All but 13 of the 60 indicators measuring beneficiaries had baselines of zero (5 of them also had no target, neither original nor revised). In these cases, the information on beneficiaries measures the size of the project’s activities but does not measure how well the project met development needs. A similar observation holds regarding the proportion of female beneficiaries: This indicator was often set to zero at baseline, rather than being expressed as a gender gap.