
The World Bank Group’s Approach to the Mobilization of Private Capital for Development
Chapter 2 | Did PCM Approaches Deliver?
This chapter describes the extent to which PCM approaches deliver results and analyzes factors that drive success. It assesses whether the Bank Group has met its PCM targets per commitments made to the G-20 and its shareholders. It then describes the extent to which PCM approaches delivered results for its clients. The assessment of results has two aspects:
- Relevance to clients, investors, and financing partners. Relevance is assessed in terms of the extent to which PCM approaches were aligned with client priorities (for example, in the country strategies or corporate clients’ financing objectives) and the extent to which instruments and platforms were deployed in accordance with investors and partner considerations.
- Effectiveness of PCM approaches reflected in projects. Effectiveness is assessed in terms of the extent to which PCM approaches led to increased service delivery to clients, repeat transactions with clients, expanded projects, repeat engagements with investors and partners, demonstration effects in other clients and institutions, and meeting of industry benchmarks in terms of investment returns.
PCM Targets
To increase PCM, the Bank Group adopted both G-20 commitments and corporate targets. Table 2.1 summarizes the Bank Group targets committed to the G-20 and to corporate shareholders as part of the 2018 capital increase package (World Bank Group 2017, 2018).1 The G-20 target for IBRD is to increase PCM volume to $6.3 billion by 2020. The G-20 target for IFC is to increase PCM volume to $10.1 billion by 2020 (table 2.1). The corporate target for IBRD is a PCM mobilization ratio of 25 percent by 2020, sustained until 2030. The corporate target for IFC is a core mobilization ratio of 80 percent by 2020, sustained until 2030.
Table 2.1. Private Capital Mobilization Levels and Targets by Bank Group Institution
|
Institution |
Volume ($, billions) |
Mobilization Ratioa (%) |
|||
|
2017 level |
2020 G-20 target |
2017 ratio |
2020–30 corporate target ratio |
||
|
IFC |
7.5 |
10.1 |
63 |
80 |
|
|
World Bank |
5.9 |
6.3 |
15 |
25 (for IBRD) |
|
Source: Multilateral development bank report to the G-20, Bank Group Capital Increase Package Proposal.
Note: G-20 = Group of Twenty; IBRD = International Bank for Reconstruction and Development; IFC = International Finance Corporation. G-20 private capital mobilization targets are at the Bank Group level.a. Measured as private capital mobilization for IBRD and core mobilization (private and public capital mobilization) for IFC. (See Key Concepts, page x).
IBRD progress on PCM targets has slowed since 2017 but scaling up is feasible. Figure 2.1 shows IBRD’s PCM volume and mobilization ratio over time. IBRD met its $5.9 billion G-20 target in FY17 through partial risk guarantee issuances to critical energy and infrastructure projects. Since FY17, IBRD’s PCM volumes have dropped to $3.7 billion in FY18 and to $2.6 billion in FY19. As noted previously, IBRD counts PCM at the time of Board approval. The Bank Group Board approval is not necessarily close to the point at which the private sources of funding are committed. If a project is canceled later, which has happened with projects mobilizing private capital, this PCM will not actually be realized, but the reported IBRD figures are not corrected. This may lead to an overestimation of actual PCM delivered by IBRD. However, the World Bank Treasury PCM activities are not tracked or recorded in the system, which understates actual mobilization volumes. IFC records both its own account and mobilization at the time of financial close and signing of the agreements with a client, making its actual PCM figures consistent with amounts mobilized. MIGA records mobilization at the time contracts are signed, thus not overestimating its PCM activities. Although it may be difficult for IBRD to meet its G-20 2020 commitment of $6.3 billion, it can realistically meet its corporate target of a 25 percent mobilization ratio on average over the next 10 years.

Source: Independent Evaluation Group calculations.
Note: G-20 = Group of Twenty; GCI = general capital increase.

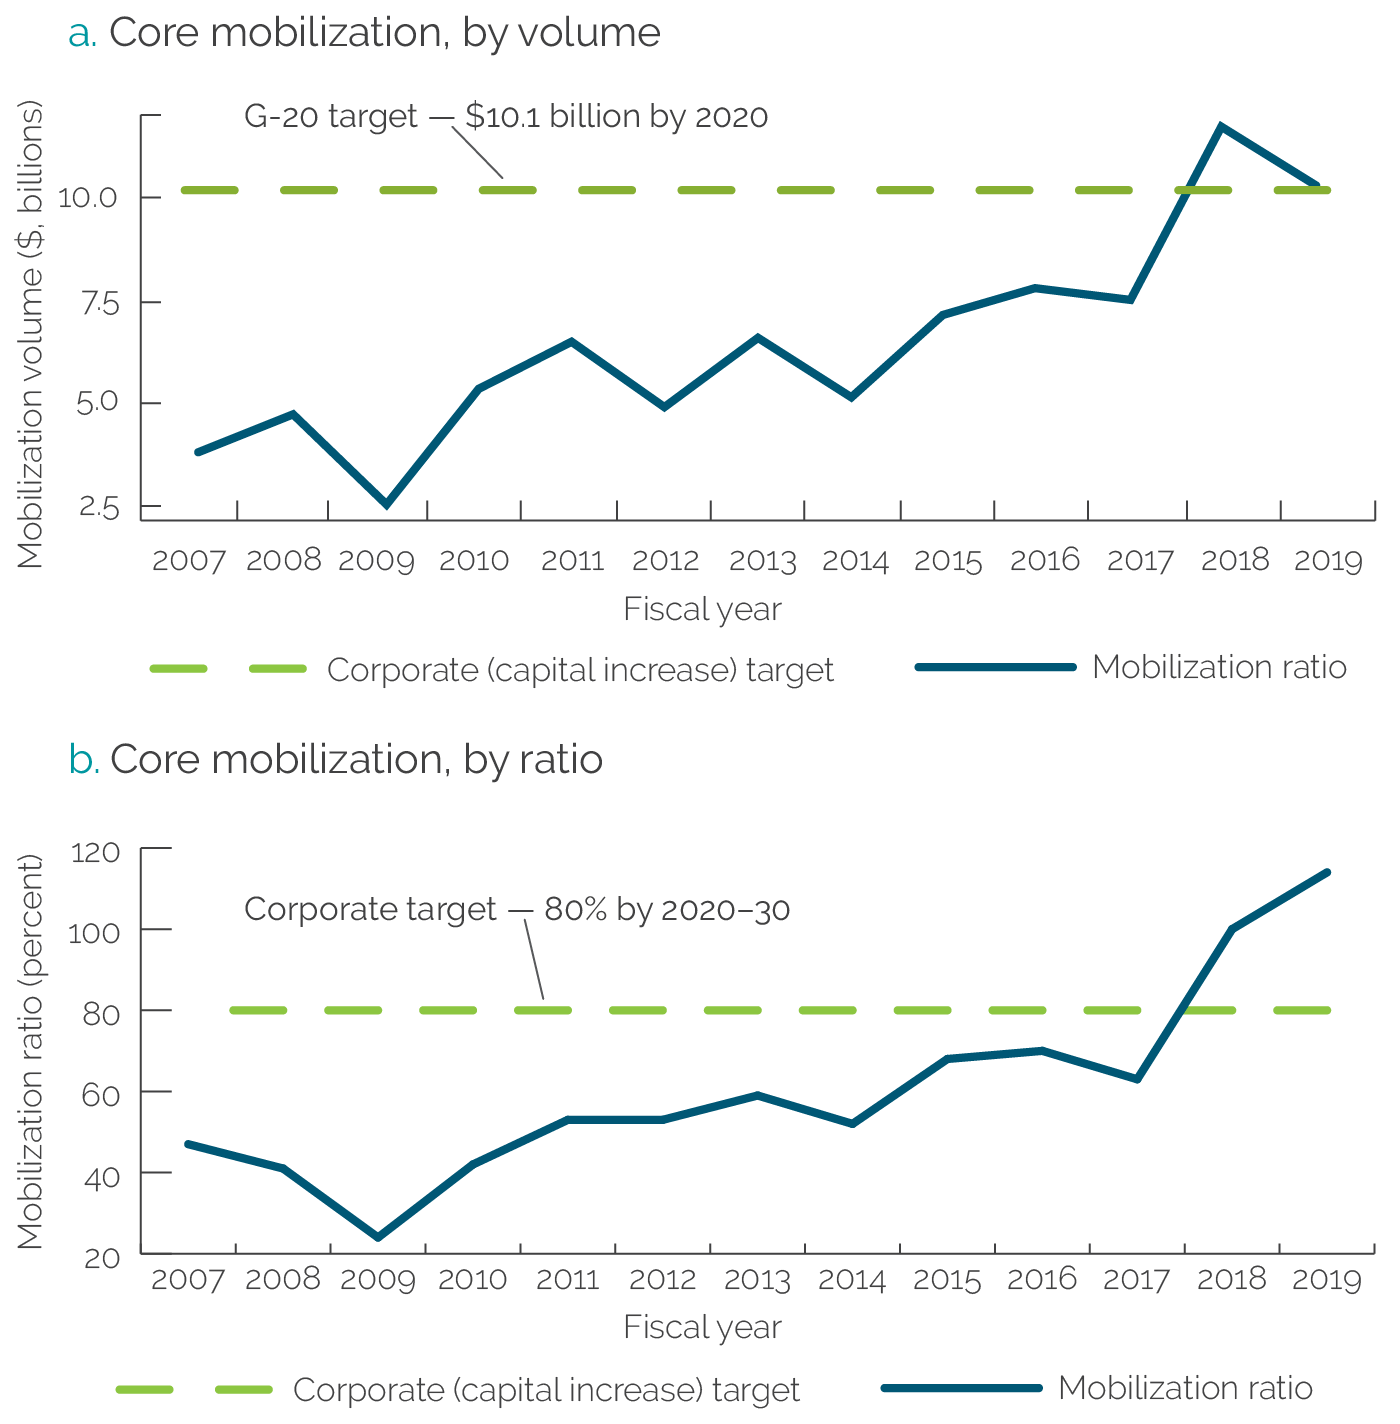
IFC has increased its mobilization ratio since 2017 and exceeded its targets in 2018 and 2019. IFC’s core mobilization volume grew from $7.5 billion (63 percent mobilization ratio) in FY17 to $11.6 billion (100 percent mobilization ratio) in FY18 (figure 2.2). In FY19, IFC mobilized $10.2 billion (114 percent mobilization ratio). As noted previously, core mobilization includes capital mobilized from both private and public sources on commercial terms (the latter including other MDBs, DFIs, and sovereign wealth funds) that is raised with the direct and active participation of IFC. In some years, public sources have been almost half of core mobilization totals. This gives IFC greater flexibility in tapping financing sources for PCM.

Source: Independent Evaluation Group calculations.
MIGA has no explicit PCM targets because all of its interventions count as PCM. MIGA’s interventions through political risk insurance and credit enhancement products count toward PCM commitments. MIGA’s reinsurance activities, through treaty and facultative reinsurance, further increase its capacity for PCM. Thus, MIGA has been growing its PCM portfolio in line with its overall business targets and priorities. In 2019, MIGA issued $5.5 billion in new guarantees in support of 37 projects, which count toward PCM, and almost double the guarantees issued in FY15 of $2.8 billion. Of the projects supported in FY19, 81 percent addressed at least one of the agency’s strategic priority areas: IDA-eligible countries, fragile and conflict-affected situations, and climate change.
MIGA has been consistently growing its (mobilization) activities in line with its strategy. The volume of MIGA’s guarantee business grew by 12 percent annual average (between FY11 and FY19) compared with a 2 percent annual average growth rate before the nonhonoring guarantee introduction (between FY02 and FY10). MIGA also insured some innovative and pioneering projects. Development outcomes from the evaluated projects were positive and confirmed MIGA’s positive role and contribution in improving environmental and social effects at the project level. The nonhonoring products crowded in an estimated $6.4 billion in private sector financing and insurance capacity to support priority public sector undertakings and optimized the financing strategy of the public borrowers and the private lenders. Support to equity investments through political risk insurance remains prominent in the MIGA portfolio, especially in countries with challenging operating environments and weak regulatory quality (Appendix M).
Climate-linked mobilization commitments are growing in the Bank Group portfolio. In the Climate Change Action Plan 2016–2020, the Bank Group made a commitment to increase the climate-related share of its lending from 21 percent to 28 percent by 2020 (World Bank, IFC, and MIGA 2016). The portion of financing that delivers on climate-focused issues is measured as climate cobenefits.2 Overall, the Bank Group climate cobenefits volume was 45 percent of the total PCM in 2018 compared with 28 percent in 2016. This ratio is similar to the overall ratio achieved by MDBs, which average 46 percent of their project portfolios. For the World Bank alone, the share of climate financing within PCM projects is growing (for example, 28 percent in climate cobenefits within PCM in 2016 versus 48 percent in climate cobenefits within PCM in 2018).
How Much and Where Has the Bank Group Mobilized Private Capital?
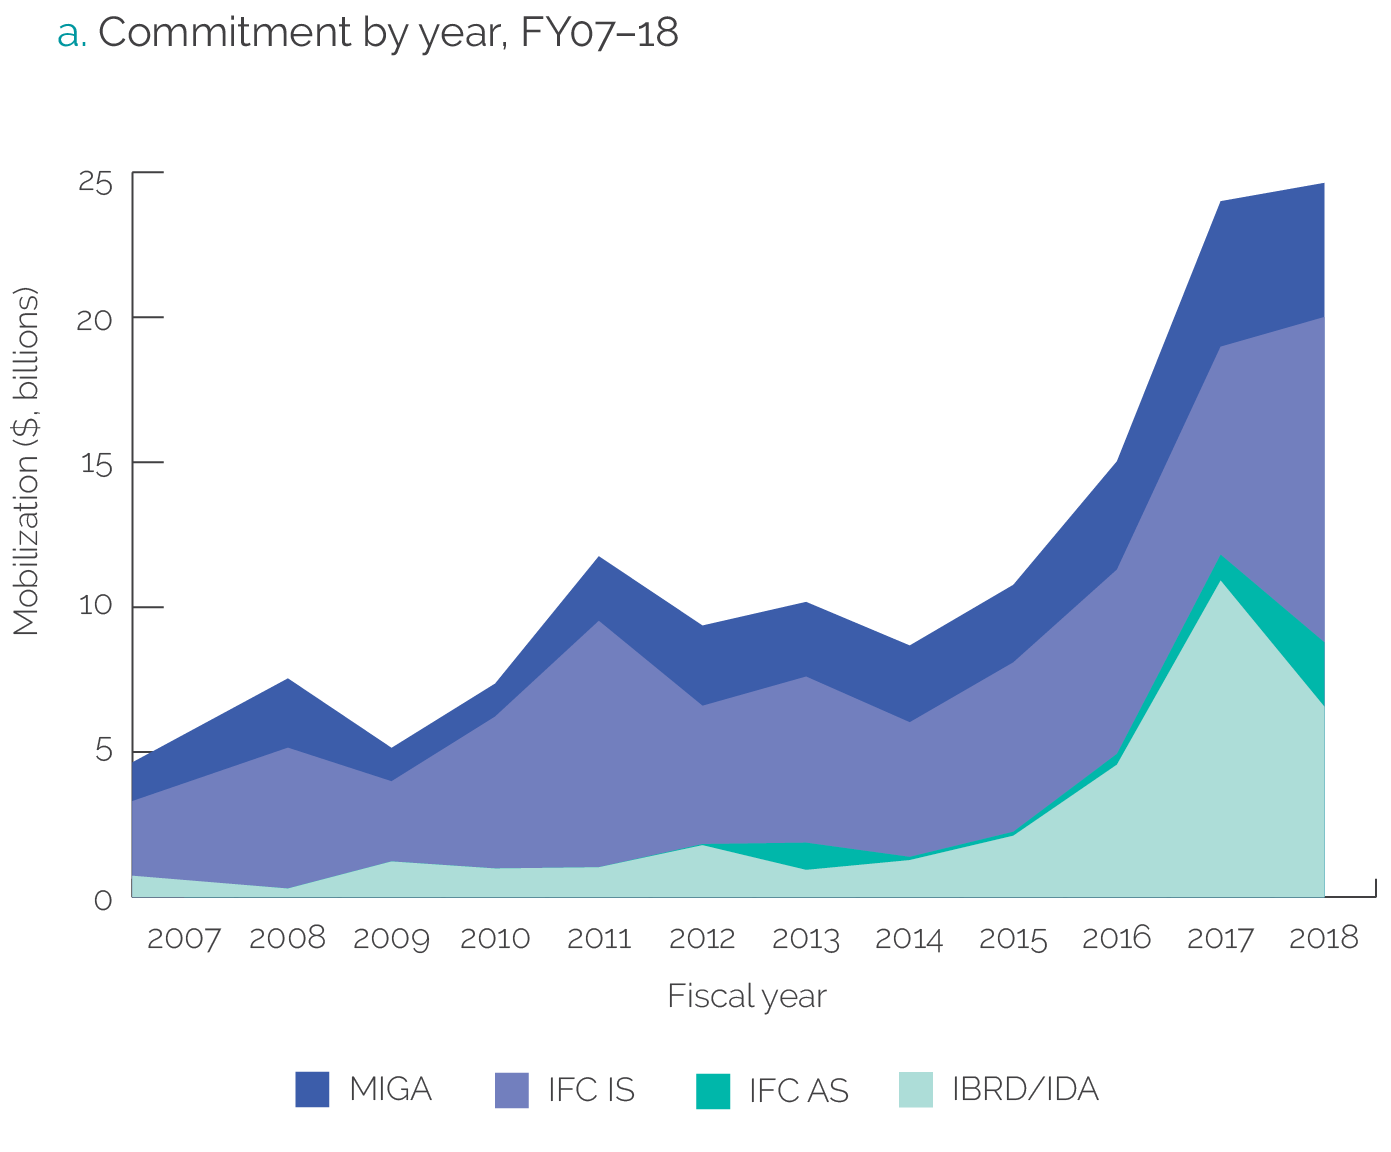
During the period FY07–18, the Bank Group approaches led to growth in both the number of engagements and the total volume of private capital mobilized. The total volume of private capital mobilized (both direct and indirect) by the Bank Group in the period FY07–18 stands at $140 billion, approximately 14 percent of total Bank Group commitments to clients during the evaluation period. Consistent with its core mandate as the private sector arm of the Bank Group, IFC mobilized the largest volume at $70 billion (50 percent of the total) across 805 projects through debt financing, equity financing, and guarantee support (figure 2.3 and table 2.2). IFC also generated a mobilization volume of close to $4.7 billion through 134 advisory projects on PPPs (4 percent of the total). During the same period, 129 World Bank projects mobilized nearly $32 billion (23 percent of the total). MIGA mobilized $33 billion (also 23 percent of the total) across 314 projects.
Figure 2.3. Private Capital Mobilization Volumes by Institution, FY07–18

Source: Independent Evaluation Group analysis based on data provided by Operations Policy and Country Services, the International Finance Corporation, and MIGA.
Note: AS = advisory services; FY = fiscal year; IBRD = International Bank for Reconstruction and Development; IDA = International Development Association; IFC = International Finance Corporation; IS = investment services; MIGA = Multilateral Investment Guarantee Agency.
Figure 2.3. Private Capital Mobilization Volumes by Institution, FY07–18
Source: Independent Evaluation Group analysis based on data provided by Operations Policy and Country Services, the International Finance Corporation, and MIGA.
Note: AS = advisory services; FY = fiscal year; IBRD = International Bank for Reconstruction and Development; IDA = International Development Association; IFC = International Finance Corporation; IS = investment services; MIGA = Multilateral Investment Guarantee Agency.
Table 2.2. World Bank Group Commitments, Mobilization and Overall, FY07–18
|
Institution |
PCM Portfolioa (no.) |
PCM ($, millions) |
Overall Bank Group Commitment and Gross Issuance ($, millions) |
|
IBRD/IDA |
129 |
32,218 |
646,000 |
|
IFC AS |
134 |
4,729 |
n.a. |
|
IFC IS |
805 |
69,910 |
336,000 |
|
MIGA |
314 |
32,666 |
34,178b |
|
Total |
1,391 |
139,523 |
1,016,178 |
Source: Independent Evaluation Group Datamart (for IBRD/IDA projects), Project Completion Report Self and Independent Evaluation Group Rating (for IFC AS projects), and Expanded Project Supervision Report database (for IFC IS projects).
Note: AS = advisory services; FY = fiscal year; IBRD = International Bank for Reconstruction and Development; IDA = International Development Association; IFC = International Finance Corporation; IS = investment services; MIGA = Multilateral Investment Guarantee Agency; n.a. = not applicable; PCM = private capital mobilization. a. All IFC AS public-private partnership projects and MIGA projects are included in the PCM portfolio. No direct financial commitment is expected from IFC AS, which is therefore denoted as not applicable. IFC data refer to core mobilization.b. Refers to MIGA gross issuance aggregate for 2007–18; data as of October 2019.
Mobilization volumes in IDA countries grew in recent years, reaching 7 percent of the total Bank Group portfolio. Most mobilization occurs in non-IDA countries.3 Between FY07 and FY18, the Bank Group mobilized nearly $88 billion in non-IDA countries and nearly $37 billion in IDA countries. However, in recent years, mobilization projects in IDA have been growing as the Bank Group prioritized IDA clients for project pipeline generation, per corporate strategy and commitments to the IDA governors. Mobilization volumes in IDA countries reached 7 percent of the total portfolio ($8 billion) in 2018 (figure 2.4). The 2018 uptick in IDA commitments was backed by a mix of IDA guarantees and IFC debt mobilization instruments for renewable energy generation in Côte d’Ivoire, Kenya, and Zambia. PCM in the IDA fragile and conflict-affected situation (FCS) portfolio has grown from $410 million in FY07 to $4.6 billion in FY18. Over the same period, PCM in non-FCS IDA countries grew from $926 million to $3.8 billion. Projects in FCS countries tend to be larger. Thus, for example, in FY18, IDA FCS projects were only 34.2 percent of the IDA portfolio of 38 projects but accounted for 54.7 percent of IDA PCM.

Source: Independent Evaluation Group portfolio review and analysis.
Note: IDA = International Development Association; PCM = private capital mobilization.

The Europe and Central Asia and Sub-Saharan Africa Regions garnered much of the Bank Group’s PCM activities and volume mobilized. The Europe and Central Asia Region attracted nearly $33 billion in private capital mobilized by the Bank Group. The Sub-Saharan Africa Region was second, attracting nearly $32 billion between 2007 and 2018, whereas the Middle East and North Africa and South Asia Regions lagged in volumes. Of these five Regions, all except Middle East and North Africa increased the ratio of mobilization-linked projects compared with the rest of the portfolio (figure 2.5). In the most recent six-year period, Europe and Central Asia mobilized nearly 11 percent of the overall Bank Group commitment in projects that mobilized. Within the Europe and Central Asia Region, Turkey received the bulk of the Bank Group support at 5 percent of all mobilization activities, by volume and number of projects.

Source: Independent Evaluation Group analysis based on data provided by Operations Policy and Country Services, the International Finance Corporation, and Multilateral Investment Guarantee Agency.
Note: EAP = East Asia and Pacific; ECA = Europe and Central Asia; FY = fiscal year; MNA = Middle East and North Africa; PCM = private capital mobilization; SAR = South Asia; SSA = Sub-Saharan Africa.
PCM Project Performance
More than half of the Bank Group PCM portfolio is in the financial and infrastructure sectors. The financial sector accounted for 29 percent of the PCM portfolio, at $39 billion, and the infrastructure sector accounted for 26 percent, at $36 billion, during the evaluation period. Within infrastructure, the energy sector garnered the most interventions at $30 billion, or 83 percent of PCM.

Source: Independent Evaluation Group analysis.
Note: The figure is not an exhaustive mapping but represents an overview of the Bank Group’s approach to support the achievement of the Sustainable Development Goals (SDGs). Given that cross-sectoral impact is delivered through investments and advisory operations in the strategic sectors, some overlaps exist in this mapping. Infrastructure includes energy and transport. SDG 1: No Poverty; SDG 2: zero hunger; SDG 3: good health and well-being; SDG 4: quality education; SDG 5: gender equality; SDG 6: clean water and sanitation; SDG 7: affordable and clean energy; SDG 8: decent work and economic Growth; SDG 9: industry, innovation and infrastructure; SDG 10: reduced Inequalities; SDG 11: sustainable cities and communities; SDG 12: Responsible consumption and Production; SDG 13: climate action; SDG 14: life below water; SDG 15: life on land; SDG 16: peace, justice,and strong institutions; SDG 17: Partnerships for the Goals.
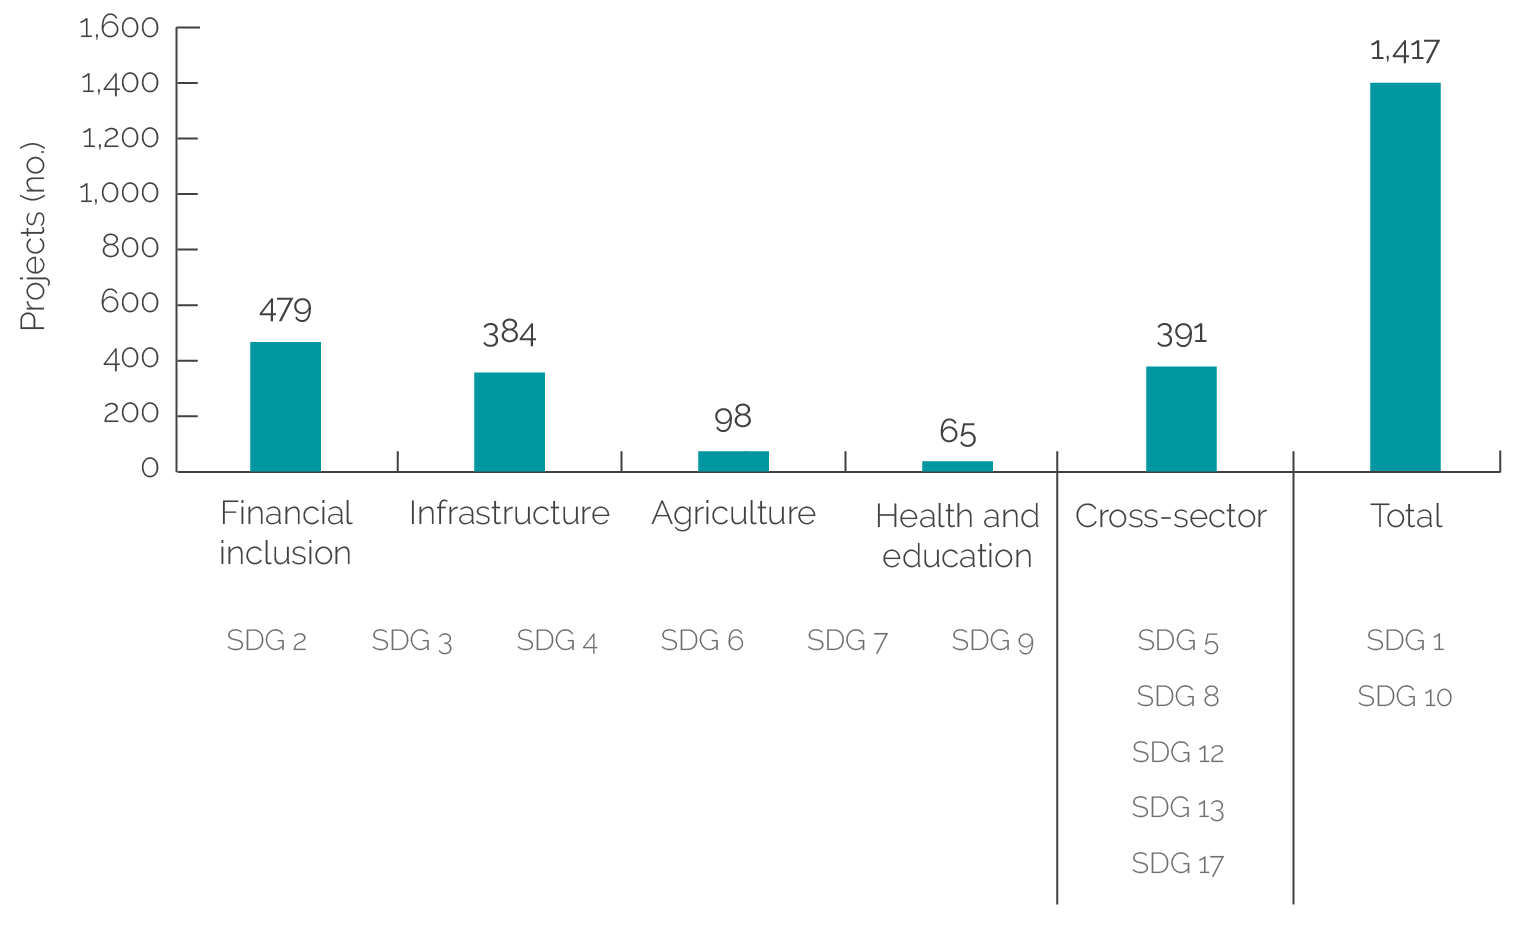
PCM projects played a critical role in several SDGs. PCM projects played a role in contributions to several SDGs, such as greater financial inclusion, greater access to infrastructure, and affordable and clean energy for firms and households (figure 2.6). PCM contributions to the SDGs benefited from the right financial incentives, regulatory structures, and standardization of contracts. PCM projects played a lesser role in social sectors (for example, health and education). Action on cross-sectoral SDGs, such as climate change (SDG 13), required PCM to heighten efficiency and reduce externalities.
Bank Group projects with PCM achieved their development outcomes more often than projects without PCM. For the World Bank, projects with PCM achieved an 83 percent development outcome success rate compared with a 76 percent overall success rate for projects without PCM, according to an analysis of 1,725 validated projects (12 PCM, 1,713 non-PCM) during the same evaluation period (figure 2.7). For IFC, PCM projects delivered a 59 percent development outcome success rate compared with projects without PCM, which had a 48 percent development outcome success rate, according to an analysis of 597 validated projects (88 PCM, 509 non-PCM). The results can be partly explained by the higher intensity and quality of the Bank Group engagements with clients, partners, and investors for PCM projects. They also reflect greater Bank Group efforts, including involvement of staff with finance backgrounds in addition to sector specialists and economists, greater scrutiny at the project preparation stage, and longer preparation times. Despite the smaller volume commitments, Bank Group projects in the East Asia and Pacific Region had the highest success rate at 87.5 percent compared with the regional average of 70 percent. Debt and guarantee-linked projects did well compared with projects relying on other types of instrument.

Source: Independent Evaluation Group portfolio review and analysis.
Note: FY = fiscal year; IFC = International Finance Corporation. Success rate is based on the ratio of the number of projects with positive development outcome rating to the number of projects evaluated in the portfolio.

Source: Independent Evaluation Group portfolio review and analysis.
Note: FY = fiscal year; IFC = International Finance Corporation. Success rate is based on the ratio of the number of projects with positive development outcome rating to the number of projects evaluated in the portfolio.
Most Bank Group PCM projects are relevant and effective. A further in-depth review of a purposefully sampled portfolio of Bank Group PCM projects suggests that 88 percent of the projects were either relevant or mostly relevant to the clients. Moreover, 90 percent of the Bank Group projects were effective or mostly effective in meeting project-level development outcome objectives (figure 2.8). For example:
- A World Bank guarantee operation to support the development of the Southern Africa Regional Gas Pipeline contributed to gas-fired power generation, which has helped broaden access to electricity, increase government revenues, create a body of expertise in the gas sector, and improve the business environment for large-scale foreign investment. Substantial further investment has flowed into Mozambique since the discovery of additional coal and offshore gas reserves. In South Africa, investment in the sector was limited by lack of competition. Although initially limited, local content purchases by the project sponsor (Sasol) gradually increased to more than 50 percent of its annual expenditure. Sasol’s local community development projects evolved over time toward more participatory and sustainable initiatives.
- An IFC PPP transaction advisory supporting the government of Punjab (India) grain silos led to financial savings of 2.7 percent of the Agency’s annual budget compared with public procurement methods used before the PPP. In Morocco, an IFC equity mobilization approach supported a financial institution that onlends to frontier regions of the country with a focus on small and medium enterprises. Between 2008 and 2011, the client disbursed more than 10.6 billion dirhams (approximately $1.2 billion) in microloans. The project reached about 300,000 low-income borrowers by 2017. In addition to facilitating the client’s outreach, the project also strengthened the client’s financial sustainability (for example, improved income) and corporate governance.
- In Pakistan and Armenia, the Systematic Country Diagnostics and Country Partnership Frameworks have provided important entry points to discuss the World Bank’s catalytic activities that may contribute to the strategic relevance of PCM activities, notwithstanding the rotation of focus sectors in the Country Partnership Framework cycle.

Source: Independent Evaluation Group analysis.
Note: Success rate assessment based on portfolio review and analysis coding method only. n.a. = not applicable; PCM = private capital mobilization.

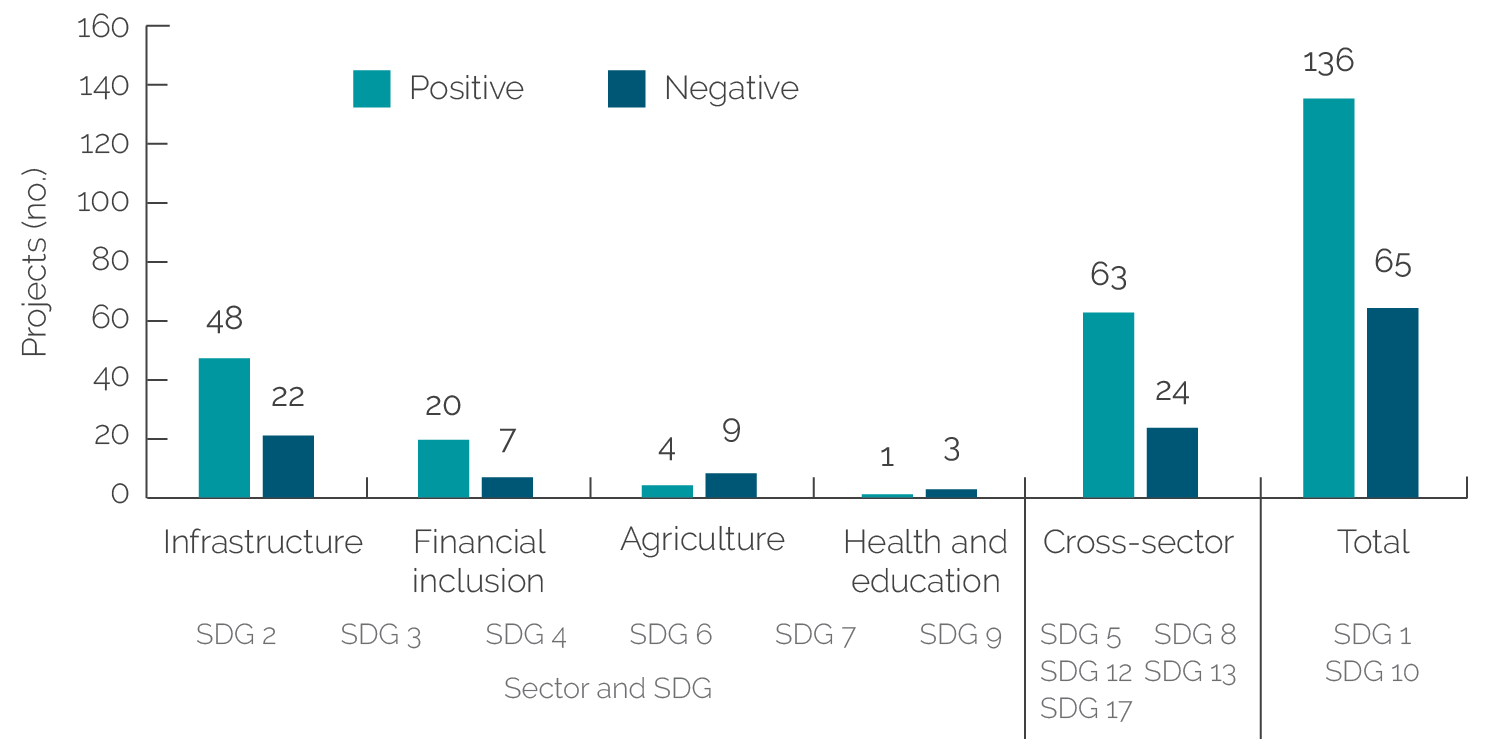
PCM infrastructure and financial sector projects performed better than agriculture and social sector projects. The difference (figure 2.9) suggests that infrastructure as an asset class is a particularly attractive business line for PCM projects. As an example, in 2010, IFC provided $50 million in long-term financing to Cálidda, the Peruvian company responsible for natural gas distribution in Lima and Callao. In addition to the direct financing, IFC mobilized an additional $35 million in private capital. Moreover, IFC’s financing was part of a $135 million package that also involved the Andean Development Corporation, a regional development bank. The private capital mobilized through IFC helped Cálidda provide gas connections to more than 45,000 Peruvian households between 2010 and 2012, expanding the capacity of its distribution network from 255 million cubic feet to 420 million cubic feet a day (SDG 7). The expansion generated more than $900 million in savings in fossil fuel use every year.

Source: Independent Evaluation Group analysis.
Note: Positive refers to projects with development outcomes rated mostly satisfactory or better. SDG 1: no poverty; SDG 2: zero hunger; SDG 3: good health and well-being; SDG 4: quality education; SDG 5: gender equality; SDG 6: clean water and sanitation; SDG 7: affordable and clean energy; SDG 8: decent work and economic growth; SDG 9: industry, innovation and infrastructure; SDG 10: reduced inequalities; SDG 11: sustainable cities and communities; SDG 12: responsible consumption and production; SDG 13: climate action; SDG 14: life below water; SDG 15: life on land; SDG 16: peace, justice, and strong institutions; SDG 17: partnerships for the goals. SDG = Sustainable Development Goal.
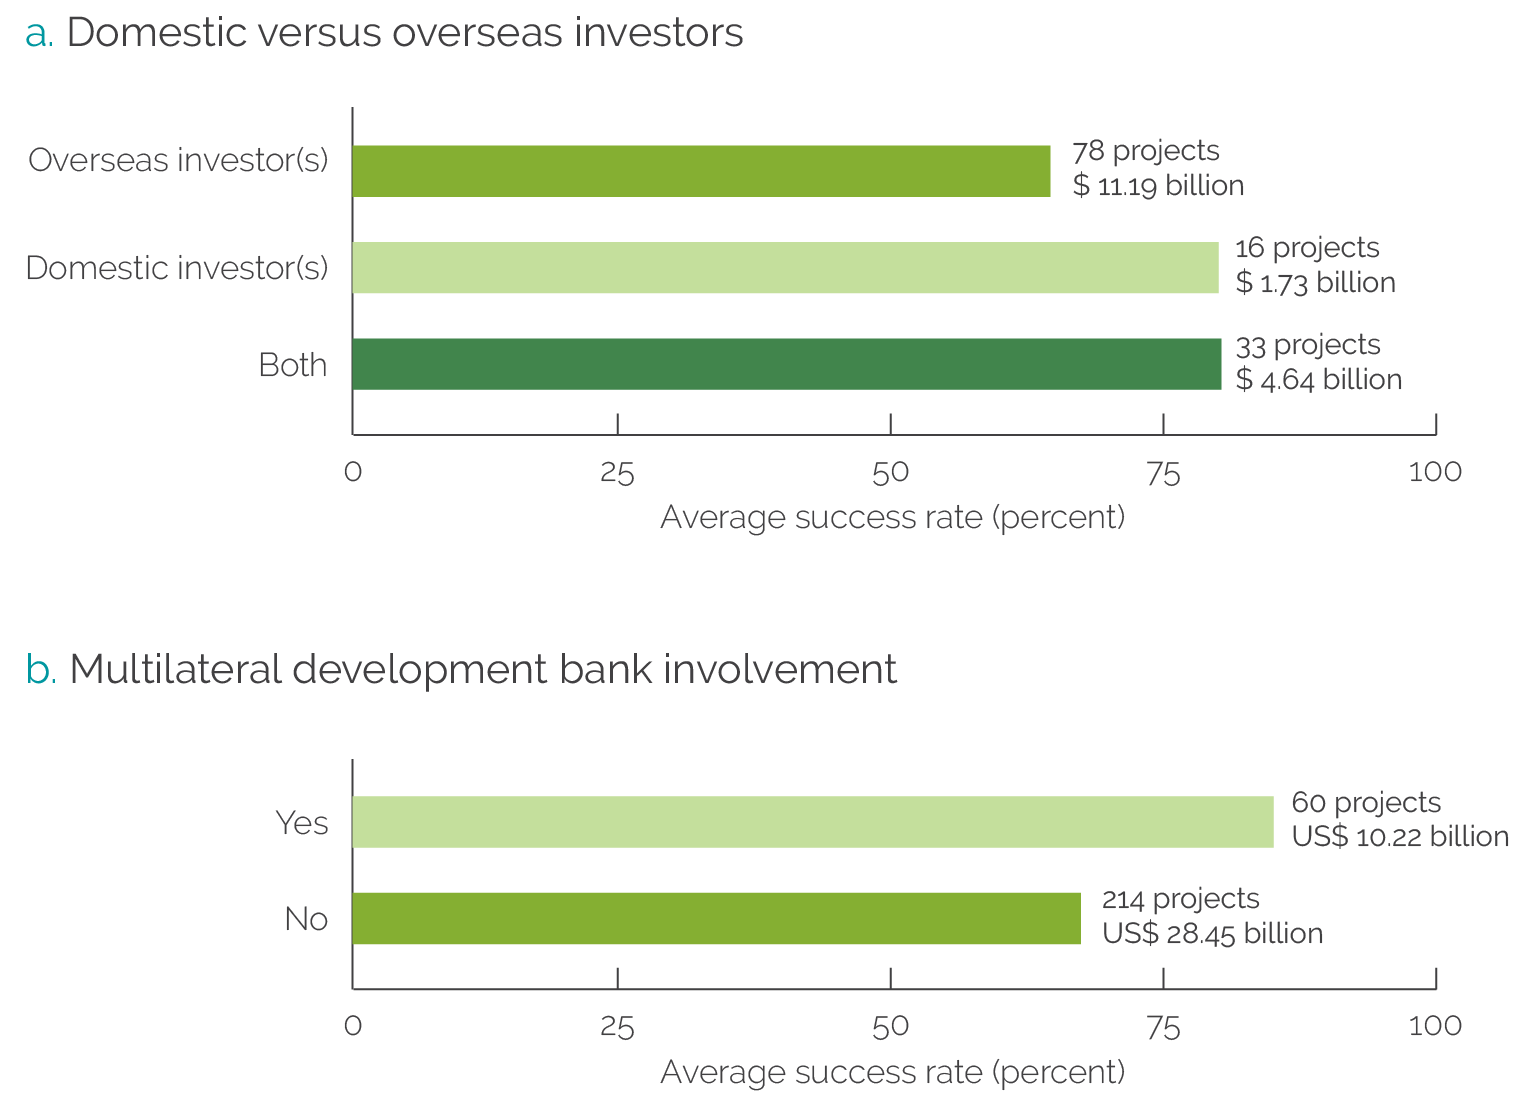
Projects with domestic investors and MDB finance achieved higher development outcome ratings than projects with foreign or South-South investors. Overseas investors were more involved in PCM projects than domestic investors were, investing $17 billion compared with domestic investors at $4 billion, according to the evaluated PCM portfolio. Yet from an outcome perspective, PCM projects with domestic investors (16) were relatively more successful at an 80 percent success rate, compared with a 64 percent success rate in PCM projects with only foreign investors (78). This can be explained by the greater amount of time and effort spent on project preparation and inputs from investors with greater knowledge of the host country. PCM projects with involvement from other MDBs had a higher success rate (60 projects, 85 percent success rate) than projects without the involvement of other MDBs (214 projects, 67 percent success rate; figure 2.10) as a result of heightened due diligence at commitment; better environmental, social, and governance alignment; and greater compliance during implementation.

Source: Independent Evaluation Group portfolio review and analysis.
IFC PCM projects were mostly effective in terms of additionality and demonstration effects. The effectiveness of PCM projects can be measured by additionality and demonstration effects (new or increased commitments or replications of aspects of the project in terms of demonstrated success).4 IFC financial additionality was observed in 32 percent of IFC PCM projects,5 but only 18.8 percent of IFC PCM projects had both financial and nonfinancial additionality. Demonstration effects were observed through IFC project-level evaluations in 25 percent of IFC PCM projects. More than 30 percent of IFC investment projects in the Europe and Central Asia Region led to demonstration effects or repeat clients or investors (figure 2.11). IFC client engagements with 78 client groups led to repeat transactions, in some cases more than three transactions. World Bank guarantees led to demonstration effects mostly in the energy sector (for example, guarantees support to the Scaling Solar Program). Demonstration effects from World Bank PCM projects overall were not significant for the small sample of projects analyzed. Examples of demonstration effects include the following:
- For phase 1 of the Colombia Fourth Generation Roads Concession Program (4G) program, which was part of a broad Bank Group engagement on infrastructure and capital market development in Colombia, IFC helped launch one of the first infrastructure debt funds in the country. The fund opened a path for institutional investors to invest in road projects that were crucial for the country. The success of phase 1 demonstrated that Colombia roads projects could be profitable investments for institutional investors, and the fund subsequently raised $400 million from pension funds.
- IFC marketed the Albania Hydros PPP engagement to a broad community of investors outside the traditional circle of Western European energy utilities. Because of this marketing campaign, the project attracted foreign investors, first from Turkey, then from Bosnia and Herzegovina and from Georgia. The success of the Albania Hydros PPP project demonstrated that energy projects in Albania could be attractive to foreign investors.

Source: Independent Evaluation Group portfolio review and analysis.
Note: Percentages represent the ratio of repeat clients to private capital mobilization engagements. EAP = East Asia and Pacific; ECA = Europe and Central Asia; LAC = Latin America and the Caribbean; MNA = Middle East and North Africa; SAR = South Asia; SSA = Sub-Saharan Africa.
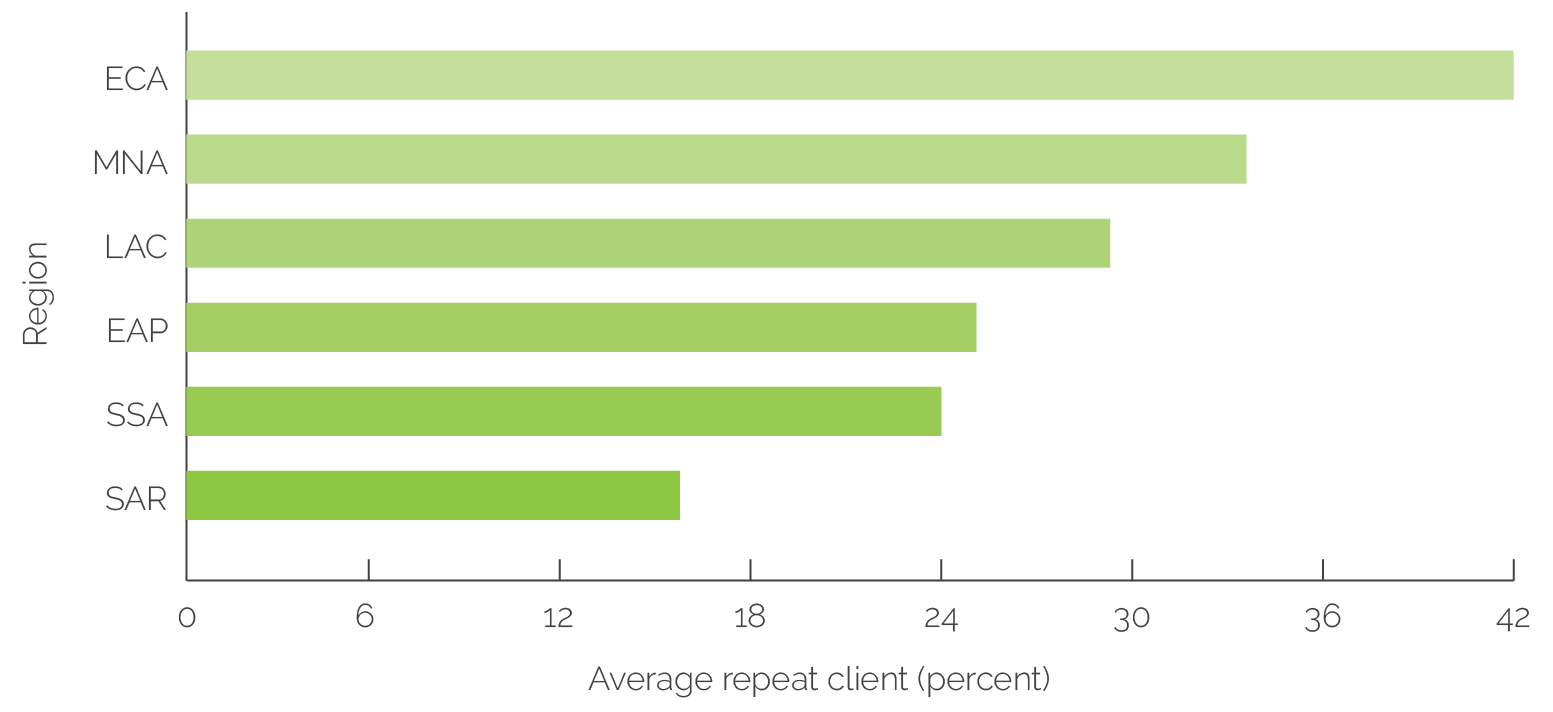
Relevance and Effectiveness of PCM Instruments
This section describes the relevance and effectiveness of Bank Group PCM instruments. It focuses on both the project design stage (when PCM instruments are introduced and investors are engaged) and the project implementation and completion stages. It covers (i) World Bank guarantees, (ii) IFC PCM debt instruments and platforms, (iii) IFC equity mobilization, (iv) IFC PPP advisory activities, and (v) MIGA guarantees. (Table 1.1 provides an overview and some examples of these instruments.)
World Bank Guarantees
World Bank guarantees were mostly relevant and effective. During the evaluation period, the World Bank used partial risk guarantees and partial credit guarantees to help clients overcome financial challenges and PBGs to help clients overcome reform challenges. The impact of the partial risk guarantees and partial credit guarantees differed depending on the issuer and the rating provided by external rating agencies (namely Standard & Poor’s, Moody’s, and Fitch Ratings). B-rated countries benefited from pricing impact, improved maturity, and facilitated market access. With lower uncovered yields, BB-rated countries benefited from marketing the guarantee’s issuance with messages about World Bank support and gained credit enhancements, potentially reaching investment grade. The PBGs were aligned with clients’ needs for improved market access, potential diversification of the creditor base, longer maturity, and lower interest rates. For example, the four PBGs issued in the Balkans allowed governments to raise new private finance of $1 billion at terms that were acceptable to the ministries of finance. The guarantees secured total commercial bank credit of €780 million, with maturities of five to seven years at the commitment stage. Similarly, in Benin, a PBG providing 40 percent coverage allowed the government to access commercial loans for $450 million at favorable terms. Through the PBG, the government of Benin made key changes in the power utility to ensure more reliable electricity, a significant investment barrier for the agricultural processing sector. Commercial and institutional investors perceived the guarantee as a signal of the World Bank’s faith in the credit and economic fundamentals of the country, for example, in Ghana (box 2.1).
Box 2.1. Relevance and Effectiveness of Policy-Based Guarantees in Ghana
The World Bank and the government of Ghana initiated a macroeconomic reform policy-based guarantee (PBG) operation, First Macroeconomic Stability for Competitiveness and Growth (2015), which included a $400 million guarantee to enable raising up to $1 billion in the international bond market. The transaction achievements included (i) the first PBG-supported bond issuance in the market in 14 years; (ii) the longest Eurobond tenor of 15 years first achieved by a Sub-Saharan Africa sovereign, except for South Africa; (iii) reduction of yields by 150–200 basis points compared with a theoretical uncovered 15-year Eurobond (theoretical because Ghana did not have stand-alone access); and (iv) a 100 percent oversubscribed order book with a diversified investor base compared with stand-alone bonds. Furthermore, about 15 percent of the final order book went to new investors, which helped expand the investor base. Ghana used the proceeds of the issue to refinance short-term domestic debt (90 days to 2 years), coming up for refinancing at a nominal interest rate of 25 percent at a time when there was no market access. Ghana’s currency, the cedi, has also been relatively stable since the Ghana 2020 issuance.
Investors choosing to invest in the Eurobond emphasized the importance of World Bank support as a necessary credit enhancement to make them comfortable with the offering. Investors first assessed Ghana’s stand-alone creditworthiness, which they considered the key investment driver. Being convinced by the creditworthiness assessment was a necessary but not sufficient condition for investment, and the PBG was instrumental in the institutional investors’ decision to invest. Investors benefited from the World Bank’s independent opinion on the country and were able to rely on a set of prior actions as part of the World Bank and International Monetary Fund reform program, helping lay a foundation for positive medium- and long-term prospects.
Source: Independent Evaluation Group Ghana case study, interviews with institutional investors.
Demand for World Bank guarantees could increase in the short term because of the coronavirus pandemic (COVID-19). In light of potentially greater demand for PBGs because of the financial implications of COVID-19 in Bank Group client countries, there is a need for more comprehensive World Bank–wide corporate guidance on borrowing modalities and on the roles and responsibilities of relevant units in the World Bank through a memorandum of understanding between the Global Practices (GPs); Infrastructure, Public-Private Partnerships, and Guarantees; and the Regions.
IFC PCM Debt Instruments and Platforms
Clients and investors perceive IFC’s PCM debt instruments and platforms—especially B loan syndications and the Managed Co-lending Portfolio Program (MCPP)—as highly relevant. B loans and the MCPP, both syndicated loans, together drive nearly 80 percent of IFC’s total PCM volume. B loan syndications and the MCPP improved the bankability and financing structure of projects compared with those that the clients would have obtained from local markets. For example, in Bangladesh, Jordan, and Zambia, commercial bank lending terms are at less than five years and are insufficient for infrastructure asset development. Investors and syndicates of commercial banks perceived IFC as a valued partner for entering difficult countries. Investors benefited from IFC’s independent opinion on the country and were able to rely on a set of prior actions (either as part of World Bank and International Monetary Fund ongoing reform programs or as part of upstream engagements), helping lay a foundation for positive medium- and long-term reform prospects.
IFC’s pioneer debt mobilization platform, MCPP-SAFE (State Administration for Foreign Exchange), has been effective. The MCPP, established in 2013, is a “wholesale” way or platform approach of mobilizing debt capital from private entities and development partners. It leverages IFC’s project pipeline and due diligence skills to source opportunities for third-party investors to co-lend to projects or groups of projects alongside IFC on commercial terms. The MCPP gives IFC the ability to provide larger financing packages than it could provide from its own account and increases the pool of financing available for achieving development goals. The MCPP leverages a loan portfolio for an investor that mirrors the portfolio IFC is creating for its own account, similar to an index fund, for example, with the Chinese institutional investor SAFE (box 2.2). MCPP has increased clients’ access to finance, especially in IDA countries, and facilitated portfolio diversification for the institutional investors.
Box 2.2. Achievements of the International Finance Corporation MCPP-SAFE Platform
The trust fund approach under the Managed Co-lending Portfolio Program (MCPP) with China’s sovereign agency State Administration of Foreign Exchange (SAFE) is an important pilot that was successfully replicated with the Hong Kong Monetary Authority to mobilize private capital. The program allowed strategic deployment of China’s foreign exchange reserves through the International Finance Corporation (IFC), generating returns, knowledge, and credit assessment insights for the Chinese sovereign-linked investor, primarily into East Asia and Pacific, Sub-Saharan Africa, and Latin America and the Caribbean. The MCPP-SAFE approach benefited from IFC’s presence across all emerging market and developing economy countries. It also benefited from access to a global pipeline of emerging market and developing economy projects. The MCPP provided SAFE with unique opportunities and access to emerging markets, a footprint SAFE does not have. SAFE considers the MCPP one of the more innovative investments in its portfolio because it allows SAFE to review and analyze similar commercial projects on a deal-by-deal basis. Private capital mobilized from SAFE was disbursed widely by region and by country groups, and was concentrated on non–International Development Association, nonfragile countries, partly driven by the characteristics of the development projects in IFC’s pipeline. Most of these borrowers have the capacity to meet their financial commitments and are less vulnerable to nonpayment than other speculative projects.
Source: Independent Evaluation Group review of the MCPP platform.
IFC’s bond mobilization platform, the Green Cornerstone Bond Fund (GCBF), has been effective. Through its pioneering GCBF, IFC achieved positive PCM outcomes in its bond mobilization efforts by increasing client firms’ access to green loans through intermediary financial institutions (for example, green loans to firms in India). In addition to supporting solar and wind generation projects, the loans were used for energy efficiency and urban transport solutions (Axis Bank 2019). This platform, developed in partnership with Amundi Fund Manager, has shown both demonstration effects in other client countries (for example, the Philippines) and replication effects in other MDBs.
IFC B loans are effective at the firm level, whereas their demonstration effects were less pronounced at the country level. B loans led to repeat transactions with clients and commercial bank partners. They had a positive effect on client firms’ access to finance. First, firms that borrowed from an IFC syndicated loan experienced a larger growth in access to funding than firms that did not borrow from an IFC syndicated loan. Second, firms that did not access the syndicated loan market before borrowing from an IFC syndicated loan were able to add an additional 70 percent in funding from private lenders after accessing an IFC syndicated loan. In this approach, both participants and borrowers benefit from IFC’s presence and activities at the project level, its risk mitigation capabilities, and its preferred creditor status. Borrowers benefit from a potentially longer tenor of the loan, diversified yet simpler documentation with IFC as the single lender of record, and new banking relationships. In many projects, client firms achieved longer tenors than were available in the local market. This yields an empirical hypothesis that involvement of IFC in the loan syndication market should lead to faster growth in this market (appendix C). However, on a country-by-country basis, IEG finds that although syndicated loan growth remains positive in the post-IFC involvement period, it is lower than growth in the pre-IFC period, suggesting less of a demonstration effect than expected from IFC’s entry into the country. Domestic lenders could not participate in the B loan program, and local currency solutions were limited. The overlap between IFC and non-IFC lending suggests that the effectiveness and additionality of the B loan program beyond firm needs is limited.
IFC Equity Mobilization
Expectations that IFC AMC will result in improvement of IFC’s development outcomes have not been realized thus far. Two of the five AMC funds evaluated (Meso-evaluation of IFC Asset Management Company, IEG, 2018) made investments which resulted in IFC mostly meeting its development objectives concerning low-income country (LIC exposure) – but IDA exposure for these funds is below levels that IFC would hope for. Although AMC has enabled IFC to finance large transactions in which it would not have otherwise been able to participate in and IFC’s investments in the funds have generated income on the IFC account, the quantity or quality of IFC’s investments or IFC’s outcomes have not changed. The number of new transactions and the investment volume of IFC have remained largely flat from equity financing approaches. AMC’s value proposition to IFC was predicated on the assumption that there is more demand for IFC’s financing than IFC has the capacity to meet from its own balance sheet. The stagnant business, however, suggests that the reverse is true and that more project pipeline generation work is required to translate latent demand into investable opportunities, in proportion to the private capital raised and pooled in the form of AMC-managed funds.
IFC PPP Advisory Activities
IFC PPP advisory services are relevant and made a significant contribution to IFC’s core mobilization, totaling more than $1 billion in recent years. Clients highly value IFC PPP advisory work, recognizing IFC’s ability to convene private sector operators for PPP bids, offer neutral review of private sector proposals, and structure PPP transaction solutions that involve expertise from various parts of the Bank Group and from other partners. They also value its ability to act as a neutral party and its contacts with emerging market investors. PPP advisory has succeeded in bringing domestic and South-South bidders from other emerging markets: more than half of projects awarded over FY07–18 had a winning bidder in one of these two categories. Mobilization volumes are concentrated in a small number of countries—Brazil accounts for almost 40 percent of mobilization volumes over the period under review, and the three largest countries (which include Colombia and the Philippines) account for 61 percent.
IFC PPP advisory services have been effective. Effectiveness was demonstrated, for example, in the Colombia 4G roads program, where joint World Bank and IFC teams undertook upstream institutional capacity building and strengthening, in addition to work on capital market policies and regulations. This, together with the IFC PPP advisory project, helped the success of the engagement, which also saw investment in projects by IFC and support by investors to MIGA. By March 2017, 32 projects in the 4G program were successfully awarded, for a total expected investment of $14.8 billion. On completion, the new highway network (293 kilometers of new roads) will significantly increase connectivity between the northern departments, the country’s coffee-growing regions, and the Port of Buenaventura. Although PPP advisory makes a sizable contribution to IFC’s core mobilization, it is small when compared with the global market for PPPs. Brazil and India, two very large PPP markets with correspondingly large advisory businesses, account for 44 percent of PPP mobilization projects. The catalytic effects stemming from IBRD’s efforts—for example, replication of transactions that do not involve IFC—are also important.
There is a positive relationship between MDB (including Bank Group) participation in PPPs and private capital mobilized subsequently as demonstration effects. IEG undertook empirical work using the Private Participation in Infrastructure Database to assess the impact of MDB financing on private infrastructure investments over 2007–18.6 Through this work, IEG found a positive relationship between MDB participation and the number of projects and the volume of investments supported through IFC PPP advisory services (appendix H). More research and analysis would be needed to ascertain causal relationships.
IFC PCM approaches can help respond to COVID-19. The most relevant instruments in the short-term response phase are IFC trade finance and distressed asset management approaches through the Global Trade Finance Program, the Global Trade Liquidity Program, and the Distressed Asset Recovery Program. In the mitigation and recovery phase, equity mobilization approaches through the AMC are highly relevant to support firms that are cash strapped and have limited capacity to take on additional debt.
MIGA Guarantees
MIGA guarantees are relevant, and MIGA has broadened the market for its PCM instruments beyond political risk insurance. Stakeholder interviews suggest that MIGA has demonstrated relevance to clients and partners’ needs in the following ways: (i) covering additional risk types (for example, through credit enhancement), (ii) broadening coverage to encompass different underlying financial instruments (for example, swaps and bond issuances), (iii) expanding coverage to new investor groups, and (iv) designing new types of project structures that increase the relevance of political risk insurance.
MIGA instruments have been relevant in crisis situations. MIGA projects in finance and capital markets evaluated by IEG in FY12–17 were created in response to the global financial crisis. Of 18 MIGA finance and capital markets projects evaluated by IEG, 14 were in the Europe and Central Asia Region. These projects focused on strengthening local financial sectors by enabling banks to improve their assets and liability management and to provide long-term funding in the markets. The projects that succeeded did so by, for example, securing financing from other financial institutions or supporting targeted rather than general-purpose interventions. Some successful projects focused on development impacts rather than merely refinancing of banks. However, most projects did not succeed. Weak outcomes stemmed from deteriorating macroeconomic conditions affecting bank performance and asset quality, high leverage, and weak environmental and social aspects in some projects.
MIGA instruments have been effective in the energy and extractive industries and infrastructure sectors, which together reveal a step change in outcome rating from 52 percent in FY06–11 to 77 percent in FY12–17. Projects in these sectors were successful because of strategic relevance to countries, a stable regulatory environment, sponsors with strong track records, stable demand, and competitive products (that is, lower production costs of power generation projects supported by MIGA). MIGA nonhonoring guarantees have been relevant but could increase effectiveness further. MIGA’s nonhonoring of financial obligations guarantee instruments demonstrated relevance to private sector clients by, for example, facilitating an investor to obtain an award to file a claim for compensation with MIGA. MIGA has enhanced its additionality through the nonhonoring guarantees instrument focused on public sector clients. Yet MIGA’s influence with its public sector clients is limited to environmental and social compliance and practices (based on IEG’s microevaluation program findings). The IEG evaluation on MIGA’s nonhonoring guarantee finds that, other than the support for better environmental and social sustainability practices, there is no evidence that MIGA’s nonhonoring insurance has encouraged public sector clients to adopt increased transparency and disclosure; good corporate governance practices; or anti-money-laundering, anticorruption, or antifraud practices (MIGA 2013).
MIGA’s reinsurance program is both relevant and effective. MIGA and its partners share risk by purchasing reinsurance policies from each other, reducing the exposure they would face individually on certain projects, sectors, or countries. This, in turn, allows MIGA to support projects that are better aligned with MIGA’s capital position and risk appetite. In recent years, MIGA has used the reinsurance program to manage exposure by working with both public and private sector reinsurers, crowding in new insurance partners and managing their portfolios, capital, and risk exposure, leading to increased potential for PCM.
MIGA’s collaborative efforts with IFC and the World Bank were backed by innovative efforts to increase its PCM volume and reinsurance capacity. Nine joint (cofinancing and sequential) projects with IFC and IBRD together, three cofinanced projects with IFC, and two with IBRD have increased MIGA’s PCM volume achievements. Through an innovative IBRD-MIGA exposure exchange agreement, MIGA further expanded its headroom for additional guarantee capacity.
MIGA has the potential to help with the COVID-19 emergency response. MIGA’s nonhonoring guarantees can help subnational governments respond to COVID-19, and MIGA could address COVID-19 implications on FDIs by innovating its product suite. MIGA’s plan to use its nonhonoring product to guarantee subnational governments’ acquisition of protective equipment and ventilators—which are critical to addressing the crisis—is timely. According to its latest Strategic Business Outlook FY21–23, MIGA has identified six initial areas for new product applications in the following areas: capital markets solutions, select local currency solutions, capital relief (especially for project finance), trade finance, systematic IFC-MIGA product collaboration, and support for domestic investors.
PCM-Led Country Reforms
Three factors are associated with PCM at the country level: (i) World Bank policy work through development policy operations (DPOs) or technical assistance that supports reforms to improve sector policy frameworks and financial viability of the sector; (ii) a deliberate, joint World Bank–IFC–MIGA approach to the enabling environment for development of a sector; and (iii) opportunistic efforts in unregulated or lightly regulated jurisdictions. Evidence is mostly based on PCM approaches in the energy sector. Evidence from projects in the financial sector or in other infrastructure sectors is limited.
Bank Group policy work supporting sector reforms based on countries’ needs enabled PCM. In cases like Ghana and Jordan, the catalytic efforts were focused on strengthening sector enabling frameworks that led to PCM. For example, in Jordan, the World Bank’s upstream interventions shaped the creation of markets and strengthened the financial situation of the utility. The interventions included technical assistance to develop the wind power market, as well as prior actions on power tariffs in development policy loans. They facilitated sustained mobilization by the World Bank in the energy sector, including in renewables. DPOs also supported macro and public sector management reforms that helped facilitate PCM in the renewable energy sector. In Ghana, sector enabling reforms were covered by prior actions for DPOs. They focused on financial sustainability of the state offtaker in the power sector. DPOs also helped introduce the Extractive Industries Transparency Initiative standards, which led to PCM activities. The World Bank supported these initiatives without an explicit joint plan or deliberate joint interventions with IFC and MIGA.
A joint, and in some cases deliberate, World Bank–IFC–MIGA effort to develop the enabling environment, including by applying the Cascade framework, is associated with PCM.
- In the Arab Republic of Egypt, the World Bank, IFC, and MIGA developed a joint approach to reforms for the broader economy—but also specifically for the energy sector—with the objective of mobilizing private capital. The World Bank and IFC developed a joint implementation plan for the energy sector, with the objective of pursuing private sector solutions first and in line with the Cascade framework. Among other things, this plan identified renewables and upstream gas as priority areas for private investment. Three World Bank development policy financing loans between 2014 and 2018 supported the enactment of relevant laws. One reformed the energy sector (including establishing an independent regulator). The second set up a strategic policy unit in the minister’s office. The third implemented a progressive increase of electricity tariffs. In 2017 and 2018, IFC provided a $200 million loan to a solar feed-in tariff program, mobilizing $450 million in B loans and parallel loans. At the same time, MIGA provided a political risk insurance guarantee of up to $197 million for solar projects (figure 2.12).

Note: DPF = development policy financing; EBRD = European Bank for Reconstruction and Development; EETC = Egyptian Electricity Transmission Company; FiT = feed-in tariff; GoE = government of Egypt; IFC = International Finance Corporation; MIGA = Multilateral Investment Guarantee Agency; MW = megawatts; TA = technical assistance.

Note: DPF = development policy financing; EBRD = European Bank for Reconstruction and Development; EETC = Egyptian Electricity Transmission Company; FiT = feed-in tariff; GoE = government of Egypt; IFC = International Finance Corporation; MIGA = Multilateral Investment Guarantee Agency; MW = megawatts; TA = technical assistance.
- In Cameroon, parallel public investments and a DPO created an enabling environment for the establishment of the first hydro plant in the country (Nachtigal). IFC financed the plant ($100 million equity investment) with a $300 million guarantee from IBRD and a $188 million guarantee from MIGA. The World Bank, through investment project financing and technical assistance, contributed to enhance the financial viability of the sector through early reforms, including the passage of a revised electricity law introducing private sector participation and supporting privatization of the state-owned power utility. Although in this case the World Bank, IFC, and MIGA did not have a joint plan focused on the energy sector and worked in parallel without a deliberate joint program from inception, their interventions were highly complementary and ultimately converged to unlock PCM opportunities (figure 2.13).
Although effective in terms of outcome achieved, implementing joint Bank Group interventions can be challenging because of procedural gaps and institutional differences. A review of joint projects found that such efforts entailed higher transaction costs caused by more coordination, overlapping processes, and differing requirements.7 These often led to delays in project completion, requiring extra project preparation, appraisal, and intra–Bank Group coordination. Clients had to comply with two sets of World Bank and IFC environmental and social requirements. Clients in joint projects (both public sector clients of the World Bank and private sector clients of IFC) also did not always understand the overlaps and complementarities between, and value added of, different Bank Group products. Furthermore, evaluative data gaps on joint Bank Group approaches at the sector level in a given country constrain PCM outcome achievements. Many project-level evaluations (more than 75 percent sampled) do not comment substantively on upstream efforts or Bank Group collaboration that preceded PCM projects.
PCM can also be achieved in countries with weak enabling environments if project designs are robust. In Argentina, the World Bank provided technical inputs to shape the approach to renewable energy, and a change in administration and approach presented an opportunity for Bank Group mobilization before a full sector reform initiative. IFC advisory services were able to assist the government in implementing its plans for renewable energy auctions, and the World Bank was able to provide a guarantee to backstop government commitments under the renewable energy fund. The Argentina example suggests that countries can succeed at PCM despite nonconducive investment climates and overall unregulated or lightly regulated environments. This indicates that the Bank Group can look for PCM opportunities even if the enabling environment is not conducive to private investment.

Note: AfDB = African Development Bank; EDF = Electricite de France; EIB = European Investment Bank; IBRD = International Bank for Reconstruction and Development; IDA = International Development Association; IFC = International Finance Corporation; IPF = investment project financing; IPP = Independent Power Producer; MIGA = Multilateral Investment Guarantee Agency; TA = technical assistance.

Note: AfDB = African Development Bank; EDF = Electricite de France; EIB = European Investment Bank; IBRD = International Bank for Reconstruction and Development; IDA = International Development Association; IFC = International Finance Corporation; IPF = investment project financing; IPP = Independent Power Producer; MIGA = Multilateral Investment Guarantee Agency; TA = technical assistance.
- The two institutions maintain different sets of definitions internally per their business model and operational needs. The World Bank counts private capital mobilization (PCM) activities at Board of Executive Directors approval rather than financing commitments from third-party capital providers. This tends to overcount World Bank PCM volumes in the case of project cancellations after approval. IFC counts public sources of capital in its core mobilization ratio but at the project commitment stage.
- Climate cobenefits are counted as the portion of project financing that delivers either mitigation or adaptation benefits to project beneficiaries.
- International Development Association status was defined as the client country’s International Development Association status at the time of project approval.
- Demonstration effects are observed in four ways:
- Financial additionality means contributions beyond what is already available in the market and not crowding out the private sector.
- Private Participation in Infrastructure Database, World Bank, Washington, DC, https://ppi.worldbank.org/en/ppi..
- Independent Evaluation Group reviews and reports have addressed some of the constraints to more effective collaboration, including the learning review of World Bank Group Joint Projects: A Review of Two Decades of Experience and the joint Independent Evaluation Group–International Finance Corporation report on joint implementation plans (World Bank 2017).